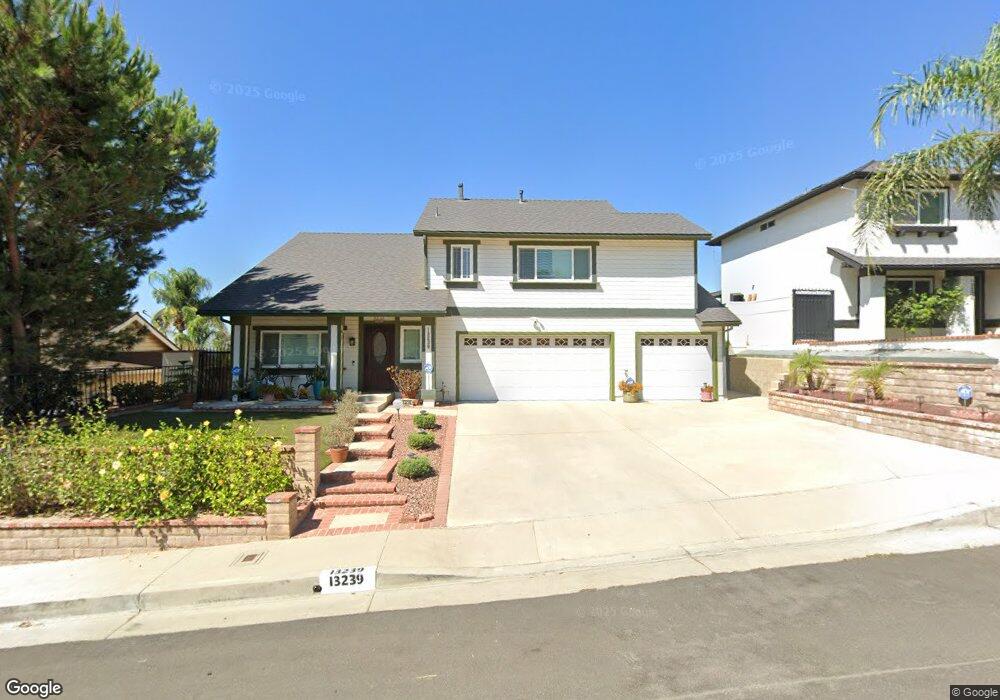
13239 Parkland Cir Sylmar, CA 91342
Estimated Value: $847,000 - $1,016,000
4
Beds
3
Baths
2,106
Sq Ft
$438/Sq Ft
Est. Value
About This Home
This home is located at 13239 Parkland Cir, Sylmar, CA 91342 and is currently estimated at $922,809, approximately $438 per square foot. 13239 Parkland Cir is a home located in Los Angeles County with nearby schools including Hubbard Street Elementary School, Olive Vista Middle School, and San Fernando Senior High School.
Ownership History
Date
Name
Owned For
Owner Type
Purchase Details
Closed on
Jan 20, 2004
Sold by
Joaquin Antonino R
Bought by
Joaquin Conchita D
Current Estimated Value
Create a Home Valuation Report for This Property
The Home Valuation Report is an in-depth analysis detailing your home's value as well as a comparison with similar homes in the area
Home Values in the Area
Average Home Value in this Area
Purchase History
| Date | Buyer | Sale Price | Title Company |
|---|---|---|---|
| Joaquin Conchita D | -- | -- |
Source: Public Records
Tax History Compared to Growth
Tax History
| Year | Tax Paid | Tax Assessment Tax Assessment Total Assessment is a certain percentage of the fair market value that is determined by local assessors to be the total taxable value of land and additions on the property. | Land | Improvement |
|---|---|---|---|---|
| 2025 | $4,431 | $333,464 | $91,547 | $241,917 |
| 2024 | $4,431 | $326,926 | $89,752 | $237,174 |
| 2023 | $4,353 | $320,517 | $87,993 | $232,524 |
| 2022 | $4,164 | $314,233 | $86,268 | $227,965 |
| 2021 | $4,106 | $308,073 | $84,577 | $223,496 |
| 2019 | $3,993 | $298,937 | $82,069 | $216,868 |
| 2018 | $3,865 | $293,076 | $80,460 | $212,616 |
| 2016 | $3,682 | $281,698 | $77,337 | $204,361 |
| 2015 | $3,632 | $277,468 | $76,176 | $201,292 |
| 2014 | $3,661 | $272,033 | $74,684 | $197,349 |
Source: Public Records
Map
Nearby Homes
- 14047 Simshaw Ave
- 13431 Lochrin Ln
- 13444 Lochrin Ln
- 13266 Dyer St
- 13382 Astoria St
- 13487 Trego Place
- 14034 Badger Ave
- 14001 Rabbit Rd
- 13410 Berg St
- 13260 Raven St
- 13864 Lexicon Ave
- 13280 Raven St
- 13266 Sayre St
- 13424 Dyer St
- 13307 Herron St
- 13095 Hubbard St Unit 1
- 13059 Hubbard St Unit 6
- 13876 Gavina Ave
- 13567 Eldridge Ave
- 13921 Candlewood Dr
- 13229 Parkland Cir
- 13247 Parkland Cir
- 13253 Parkland Cir
- 13978 Simshaw Ave
- 13223 Parkland Cir
- 13974 Simshaw Ave
- 13986 Simshaw Ave
- 13240 Parkland Cir
- 13246 Parkland Cir
- 13966 Simshaw Ave
- 13234 Parkland Cir
- 13992 Simshaw Ave
- 13265 Parkland Cir
- 13215 Parkland Cir
- 13254 Parkland Cir
- 13228 Parkland Cir
- 14030 Simshaw Ave
- 13956 Simshaw Ave
- 13258 Parkland Cir
- 13222 Parkland Cir