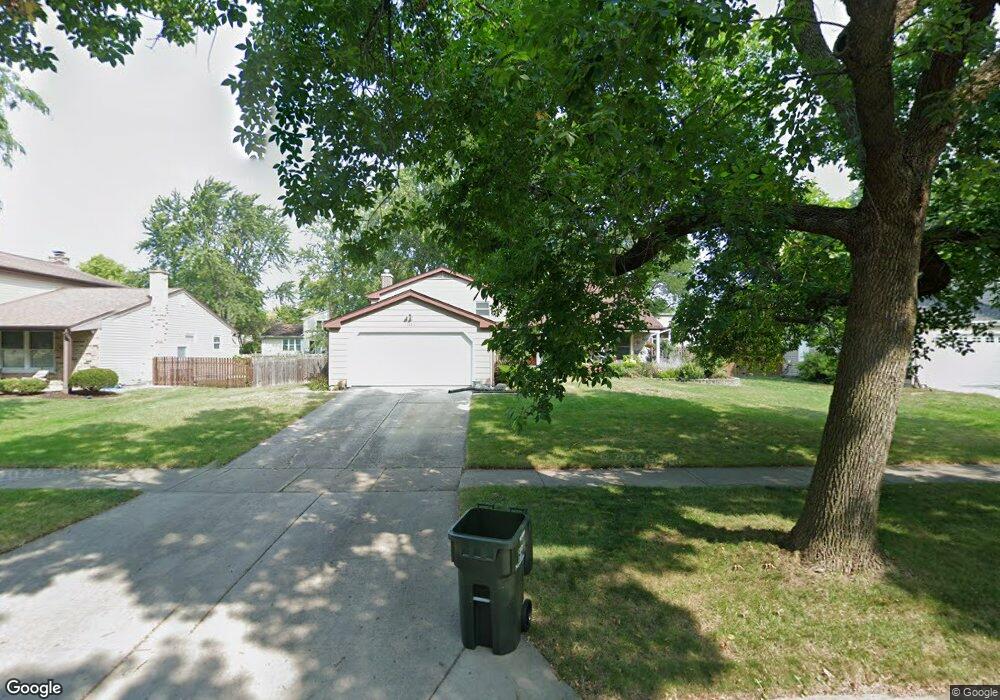
1325 W Jefferson Ave Unit 3 Naperville, IL 60540
Will-O-Way NeighborhoodEstimated Value: $556,513 - $627,000
4
Beds
3
Baths
2,483
Sq Ft
$244/Sq Ft
Est. Value
About This Home
This home is located at 1325 W Jefferson Ave Unit 3, Naperville, IL 60540 and is currently estimated at $604,628, approximately $243 per square foot. 1325 W Jefferson Ave Unit 3 is a home located in DuPage County with nearby schools including Elmwood Elementary School, Lincoln Jr. High School, and Naperville Central High School.
Ownership History
Date
Name
Owned For
Owner Type
Purchase Details
Closed on
Nov 29, 2010
Sold by
Longbons Van T and Longbons Robin L
Bought by
Vollmer Scott D and Vollmer Bridget K
Current Estimated Value
Home Financials for this Owner
Home Financials are based on the most recent Mortgage that was taken out on this home.
Original Mortgage
$296,013
Outstanding Balance
$197,058
Interest Rate
4.37%
Mortgage Type
FHA
Estimated Equity
$407,570
Purchase Details
Closed on
Mar 30, 2001
Sold by
Kieklak Lawrence Lewis and Rotunno Lynn A
Bought by
Longbons Van T and Longbons Robin L
Home Financials for this Owner
Home Financials are based on the most recent Mortgage that was taken out on this home.
Original Mortgage
$184,000
Interest Rate
7.05%
Purchase Details
Closed on
Sep 18, 1998
Sold by
Bessey James P and Bessey Kathleen D
Bought by
Kieklak Lawrence Lewis and Kieklak Lynn Ann
Home Financials for this Owner
Home Financials are based on the most recent Mortgage that was taken out on this home.
Original Mortgage
$120,500
Interest Rate
6.99%
Create a Home Valuation Report for This Property
The Home Valuation Report is an in-depth analysis detailing your home's value as well as a comparison with similar homes in the area
Home Values in the Area
Average Home Value in this Area
Purchase History
| Date | Buyer | Sale Price | Title Company |
|---|---|---|---|
| Vollmer Scott D | $300,000 | Ctic | |
| Longbons Van T | $230,000 | First American Title Ins | |
| Kieklak Lawrence Lewis | $178,000 | -- |
Source: Public Records
Mortgage History
| Date | Status | Borrower | Loan Amount |
|---|---|---|---|
| Open | Vollmer Scott D | $296,013 | |
| Previous Owner | Longbons Van T | $184,000 | |
| Previous Owner | Kieklak Lawrence Lewis | $120,500 |
Source: Public Records
Tax History Compared to Growth
Tax History
| Year | Tax Paid | Tax Assessment Tax Assessment Total Assessment is a certain percentage of the fair market value that is determined by local assessors to be the total taxable value of land and additions on the property. | Land | Improvement |
|---|---|---|---|---|
| 2024 | $9,028 | $155,216 | $53,864 | $101,352 |
| 2023 | $8,530 | $139,470 | $48,400 | $91,070 |
| 2022 | $8,009 | $129,960 | $44,750 | $85,210 |
| 2021 | $7,724 | $125,320 | $43,150 | $82,170 |
| 2020 | $7,699 | $125,320 | $43,150 | $82,170 |
| 2019 | $7,420 | $119,190 | $41,040 | $78,150 |
| 2018 | $7,128 | $114,900 | $39,250 | $75,650 |
| 2017 | $6,978 | $111,000 | $37,920 | $73,080 |
| 2016 | $6,805 | $106,520 | $36,390 | $70,130 |
| 2015 | $6,809 | $101,140 | $34,550 | $66,590 |
| 2014 | $6,648 | $96,060 | $32,550 | $63,510 |
| 2013 | $6,603 | $96,730 | $32,780 | $63,950 |
Source: Public Records
Map
Nearby Homes
- 122 Encina Dr
- 134 S Whispering Hills Dr
- 1212 Whispering Hills Ct Unit 2B
- 1099 W Jefferson Ave
- 1116 Hidden Spring Dr
- 319 Claremont Ct
- 1215 Chalet Rd Unit 101
- 417 River Bluff Cir
- 479 River Bend Rd Unit 111
- 21 Forest Ave
- 7S410 Arbor Dr
- 1041 W Ogden Ave Unit 320
- 511 Aurora Ave Unit 108
- 1117 Summit Hills Ln
- 1748 Windward Ave Unit 92
- 225 N Mill St
- 107 S Webster St
- 103 S Webster St
- 243 Box Car Ave
- 1125 Royal Saint George Dr Unit 208
- 1317 W Jefferson Ave
- 1333 W Jefferson Ave
- 1322 Wilshire Dr
- 1309 W Jefferson Ave Unit 2
- 1316 Wilshire Dr
- 1341 W Jefferson Ave
- 1328 Wilshire Dr Unit 7
- 1310 Wilshire Dr
- 1324 W Jefferson Ave
- 1316 W Jefferson Ave
- 1332 W Jefferson Ave
- 1349 W Jefferson Ave
- 165 S River Rd
- 1340 W Jefferson Ave
- 1308 W Jefferson Ave
- 117 S River Rd
- 1340 Wilshire Dr
- 205 S River Rd
- 1353 W Jefferson Ave Unit 3
- 1348 W Jefferson Ave