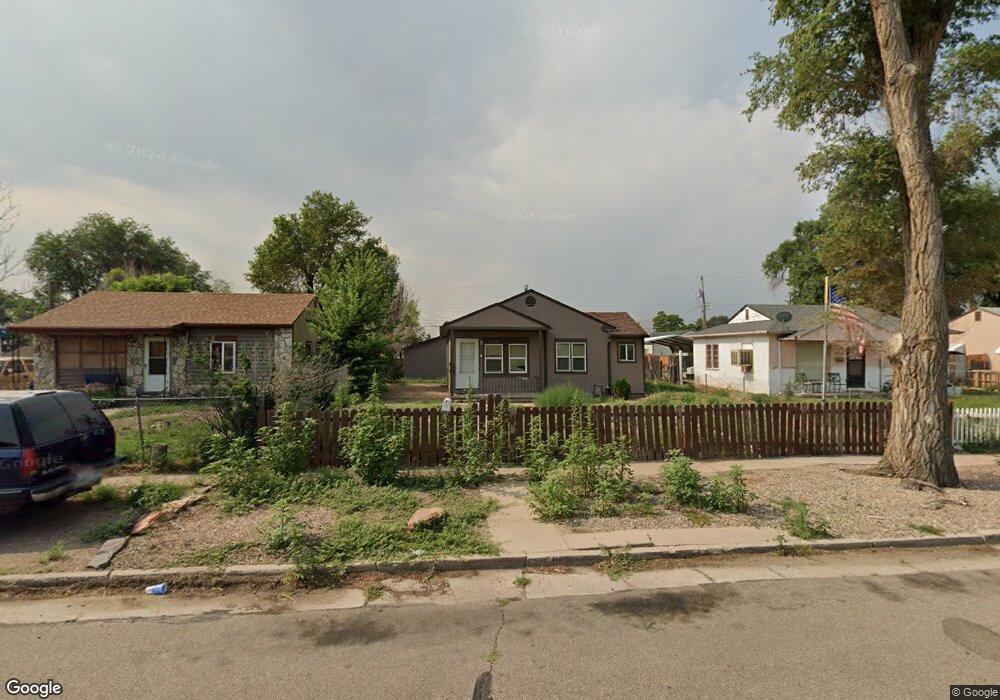
1326 E 19th St Pueblo, CO 81001
East Side NeighborhoodEstimated Value: $160,000 - $172,924
2
Beds
1
Bath
660
Sq Ft
$251/Sq Ft
Est. Value
About This Home
This home is located at 1326 E 19th St, Pueblo, CO 81001 and is currently estimated at $165,731, approximately $251 per square foot. 1326 E 19th St is a home located in Pueblo County with nearby schools including Park View Elementary School, Risley International Academy of Innovation, and East High School.
Ownership History
Date
Name
Owned For
Owner Type
Purchase Details
Closed on
Sep 27, 2012
Sold by
Saisi Alfred D
Bought by
Hill Nelson B and Hill Alice L
Current Estimated Value
Purchase Details
Closed on
Jan 6, 2003
Sold by
Federal National Mort Assoc
Bought by
Saisi Alfred D
Purchase Details
Closed on
Dec 11, 2002
Sold by
Griego Randall J
Bought by
Federal National Mort Assoc
Purchase Details
Closed on
Mar 30, 1999
Sold by
Griego Randy J +
Bought by
Griego Randall J
Purchase Details
Closed on
Sep 23, 1994
Sold by
Savage Ted E + Verna
Bought by
Griego Randy J + Kim
Purchase Details
Closed on
Aug 8, 1994
Sold by
Stewart Michelle
Bought by
Savage Ted E + Verna
Purchase Details
Closed on
Aug 21, 1984
Sold by
Fouts Kenneth B
Bought by
Stewart Michelle
Purchase Details
Closed on
Aug 27, 1980
Sold by
Fouts Kenneth B+
Bought by
Fouts Kenneth B
Purchase Details
Closed on
Jun 8, 1971
Bought by
Fouts Kenneth B + Hee Soo
Create a Home Valuation Report for This Property
The Home Valuation Report is an in-depth analysis detailing your home's value as well as a comparison with similar homes in the area
Home Values in the Area
Average Home Value in this Area
Purchase History
| Date | Buyer | Sale Price | Title Company |
|---|---|---|---|
| Hill Nelson B | $33,000 | Land Title Guarantee Company | |
| Saisi Alfred D | $47,500 | -- | |
| Federal National Mort Assoc | -- | -- | |
| Griego Randall J | -- | -- | |
| Griego Randy J + Kim | $39,000 | -- | |
| Savage Ted E + Verna | $22,500 | -- | |
| Stewart Michelle | $23,100 | -- | |
| Fouts Kenneth B | -- | -- | |
| Fouts Kenneth B + Hee Soo | -- | -- |
Source: Public Records
Tax History
| Year | Tax Paid | Tax Assessment Tax Assessment Total Assessment is a certain percentage of the fair market value that is determined by local assessors to be the total taxable value of land and additions on the property. | Land | Improvement |
|---|---|---|---|---|
| 2024 | $658 | $6,670 | -- | -- |
| 2023 | $666 | $10,360 | $1,010 | $9,350 |
| 2022 | $782 | $7,880 | $1,040 | $6,840 |
| 2021 | $808 | $8,110 | $1,070 | $7,040 |
| 2020 | $480 | $7,640 | $1,070 | $6,570 |
| 2019 | $480 | $4,758 | $501 | $4,257 |
| 2018 | $387 | $4,270 | $504 | $3,766 |
| 2017 | $391 | $4,270 | $504 | $3,766 |
| 2016 | $322 | $3,542 | $557 | $2,985 |
| 2015 | $160 | $3,542 | $557 | $2,985 |
| 2014 | $186 | $4,101 | $557 | $3,544 |
Source: Public Records
Map
Nearby Homes
- 1221 Maudslay Ave
- 1455 Cody Ave
- 1105 Maudslay Ave
- 1530 N Norwood Ave
- 1112 Kennedy St
- 1403 Anita St
- 1620 N Ogden Ave
- 1109 Mass St
- 1200 Alexander Cir
- 1506 N Ogden Ave
- 1424 E 14th St
- 920 Kennedy St
- 1512 Saratoga Rd
- 1336 E 13th St
- 1512 Alexander Cir
- 1512 E 21st St Unit B
- 1631 E 14th St
- 2101 N Queens Ave
- 1829 N Queens Ave
- 1009 Constitution Rd
Your Personal Tour Guide
Ask me questions while you tour the home.