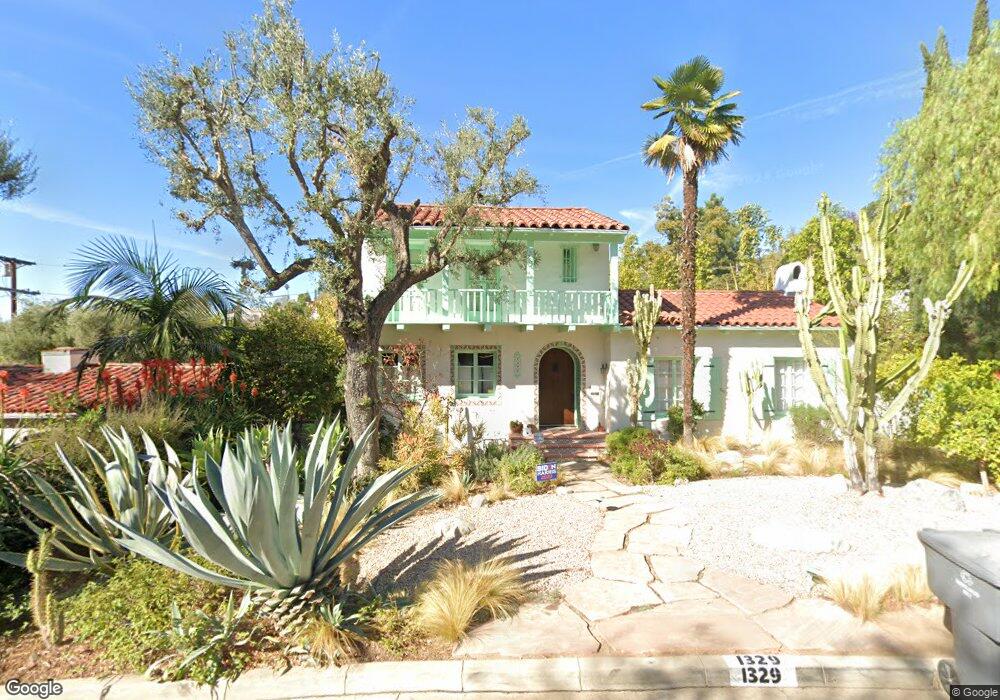
1329 Loreto Dr Glendale, CA 91207
Rossmoyne NeighborhoodEstimated Value: $1,694,000 - $2,213,000
4
Beds
3
Baths
3,042
Sq Ft
$654/Sq Ft
Est. Value
About This Home
This home is located at 1329 Loreto Dr, Glendale, CA 91207 and is currently estimated at $1,988,344, approximately $653 per square foot. 1329 Loreto Dr is a home located in Los Angeles County with nearby schools including R.D. White Elementary School, Woodrow Wilson Middle School, and Glendale High School.
Ownership History
Date
Name
Owned For
Owner Type
Purchase Details
Closed on
Feb 8, 2001
Sold by
Axelrad John E and Allicotti Sharon Jayne
Bought by
Axelrad John E and Allicotti Sharon Jayne
Current Estimated Value
Home Financials for this Owner
Home Financials are based on the most recent Mortgage that was taken out on this home.
Original Mortgage
$228,600
Outstanding Balance
$82,574
Interest Rate
7.08%
Estimated Equity
$1,905,771
Purchase Details
Closed on
Oct 15, 1999
Sold by
Axelrad John E and Allicotti Sharon Jayne
Bought by
Axelrad John E and Allicotti Sharon Jayne
Purchase Details
Closed on
Aug 6, 1996
Sold by
Wells John and John & Dorothy Wells Family Tr
Bought by
Axelrad John E and Axelrad Sharon Alliccotti
Home Financials for this Owner
Home Financials are based on the most recent Mortgage that was taken out on this home.
Original Mortgage
$235,200
Interest Rate
8.23%
Create a Home Valuation Report for This Property
The Home Valuation Report is an in-depth analysis detailing your home's value as well as a comparison with similar homes in the area
Home Values in the Area
Average Home Value in this Area
Purchase History
| Date | Buyer | Sale Price | Title Company |
|---|---|---|---|
| Axelrad John E | -- | Fidelity National Title Co | |
| Axelrad John E | -- | Equity Title Company | |
| Axelrad John E | -- | -- | |
| Axelrad John E | $294,000 | Old Republic Title |
Source: Public Records
Mortgage History
| Date | Status | Borrower | Loan Amount |
|---|---|---|---|
| Open | Axelrad John E | $228,600 | |
| Closed | Axelrad John E | $235,200 |
Source: Public Records
Tax History
| Year | Tax Paid | Tax Assessment Tax Assessment Total Assessment is a certain percentage of the fair market value that is determined by local assessors to be the total taxable value of land and additions on the property. | Land | Improvement |
|---|---|---|---|---|
| 2025 | $5,463 | $488,058 | $281,588 | $206,470 |
| 2024 | $5,463 | $478,489 | $276,067 | $202,422 |
| 2023 | $5,342 | $469,107 | $270,654 | $198,453 |
| 2022 | $5,247 | $459,910 | $265,348 | $194,562 |
| 2021 | $5,143 | $450,894 | $260,146 | $190,748 |
| 2019 | $4,948 | $437,523 | $252,431 | $185,092 |
| 2018 | $4,820 | $428,945 | $247,482 | $181,463 |
| 2016 | $4,571 | $412,290 | $237,873 | $174,417 |
| 2015 | $4,479 | $406,098 | $234,300 | $171,798 |
| 2014 | $4,444 | $398,144 | $229,711 | $168,433 |
Source: Public Records
Map
Nearby Homes
- 1321 Greenbriar Rd
- 1430 E Mountain St
- 1248 N Everett St
- 1535 Royal Blvd
- 1152 N Cedar St
- 1239 Geneva St
- 640 Bohlig Rd
- 1558 Remah Vista Dr
- 1433 Del Monte Dr
- 736 Cavanagh Rd
- 966 E Glenoaks Blvd
- 1238 N Isabel St
- 1659 Puebla Dr
- 728 Cordova Ave
- 404 E Randolph St
- 1130 Campbell St Unit 106
- 900 Glenvista Dr
- 320 E Stocker St Unit 208
- 320 E Stocker St Unit 205
- 630 Naranja Dr
- 954 Rosemount Rd
- 1323 Loreto Dr
- 960 Rosemount Rd
- 1338 Sinaloa Dr
- 1344 Sinaloa Dr
- 1328 Loreto Dr
- 1324 Loreto Dr
- 1334 Sinaloa Dr
- 1319 Loreto Dr
- 1332 Loreto Dr
- 1320 Loreto Dr
- 1328 Sinaloa Dr
- 1338 Loreto Dr
- 1316 Loreto Dr
- 1315 Loreto Dr
- 955 Rosemount Rd
- 959 Rosemount Rd
- 1340 Loreto Dr
- 1324 Sinaloa Dr
- 1333 Rossmoyne Ave
Your Personal Tour Guide
Ask me questions while you tour the home.