Estimated Value: $565,000 - $673,319
3
Beds
3
Baths
1,883
Sq Ft
$327/Sq Ft
Est. Value
About This Home
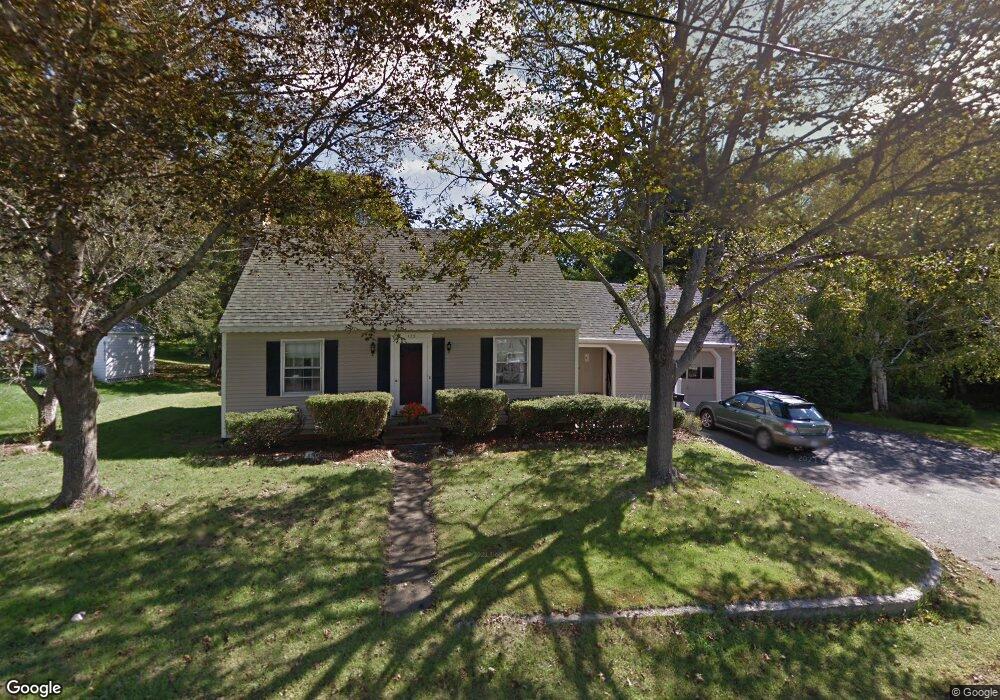
This home is located at 133 Grove St, Dover, NH 03820 and is currently estimated at $615,580, approximately $326 per square foot. 133 Grove St is a home located in Strafford County with nearby schools including Horne Street School, Dover Middle School, and Dover Senior High School.
Ownership History
Date
Name
Owned For
Owner Type
Purchase Details
Closed on
Sep 3, 2002
Sold by
Lunt David W and Lunt Valerie S
Bought by
Woodward Kirby N and Woodward Mylinda S
Current Estimated Value
Home Financials for this Owner
Home Financials are based on the most recent Mortgage that was taken out on this home.
Original Mortgage
$226,100
Interest Rate
6.55%
Create a Home Valuation Report for This Property
The Home Valuation Report is an in-depth analysis detailing your home's value as well as a comparison with similar homes in the area
Home Values in the Area
Average Home Value in this Area
Purchase History
| Date | Buyer | Sale Price | Title Company |
|---|---|---|---|
| Woodward Kirby N | $238,000 | -- |
Source: Public Records
Mortgage History
| Date | Status | Borrower | Loan Amount |
|---|---|---|---|
| Open | Woodward Kirby N | $190,300 | |
| Closed | Woodward Kirby N | $31,465 | |
| Closed | Woodward Kirby N | $226,100 |
Source: Public Records
Tax History Compared to Growth
Tax History
| Year | Tax Paid | Tax Assessment Tax Assessment Total Assessment is a certain percentage of the fair market value that is determined by local assessors to be the total taxable value of land and additions on the property. | Land | Improvement |
|---|---|---|---|---|
| 2024 | $10,493 | $577,500 | $146,200 | $431,300 |
| 2023 | $9,975 | $533,400 | $154,800 | $378,600 |
| 2022 | $9,841 | $496,000 | $154,800 | $341,200 |
| 2021 | $9,617 | $443,200 | $137,600 | $305,600 |
| 2020 | $8,901 | $358,200 | $107,500 | $250,700 |
| 2019 | $9,114 | $361,800 | $116,100 | $245,700 |
| 2018 | $8,530 | $342,300 | $103,200 | $239,100 |
| 2017 | $8,237 | $318,400 | $86,000 | $232,400 |
| 2016 | $7,377 | $280,600 | $75,500 | $205,100 |
| 2015 | $7,339 | $275,800 | $75,500 | $200,300 |
| 2014 | $7,174 | $275,800 | $75,500 | $200,300 |
| 2011 | $6,448 | $256,700 | $71,700 | $185,000 |
Source: Public Records
Map
Nearby Homes
- 57 Maple St Unit 2
- 725 Central Ave Unit 203
- 725 Central Ave Unit LL03
- 725 Central Ave Unit 301
- 725 Central Ave Unit 302
- 725 Central Ave Unit LL01
- 725 Central Ave Unit 304
- 713 Central Ave Unit 1
- 34 Floral Ave Unit 5
- 36 Oak St
- 63 Sixth St
- 815 Central Ave
- 47 Central Ave
- 96 Broadway Unit 98
- 45 New York St Unit 8
- 18 5th St
- 0 4th St Unit 2
- 1 Prospect Ct
- 5 Cedarbrook Dr
- 23 Townsend Dr
- 131 Grove St
- 2 Chesley St
- 4 Chesley St
- 112 Mount Vernon St
- 114 Mount Vernon St
- 116 Mount Vernon St
- 108 Mount Vernon St
- 132 Grove St
- 110 Mount Vernon St
- 118 Mount Vernon St
- 130 Grove St
- 129 Grove St
- 106 Mount Vernon St
- 6 Chesley St
- 134 Grove St
- 3 Chesley St
- 1 Chesley St
- 105 Mt Vernon St
- 105 Mount Vernon St
- 120 Mount Vernon St