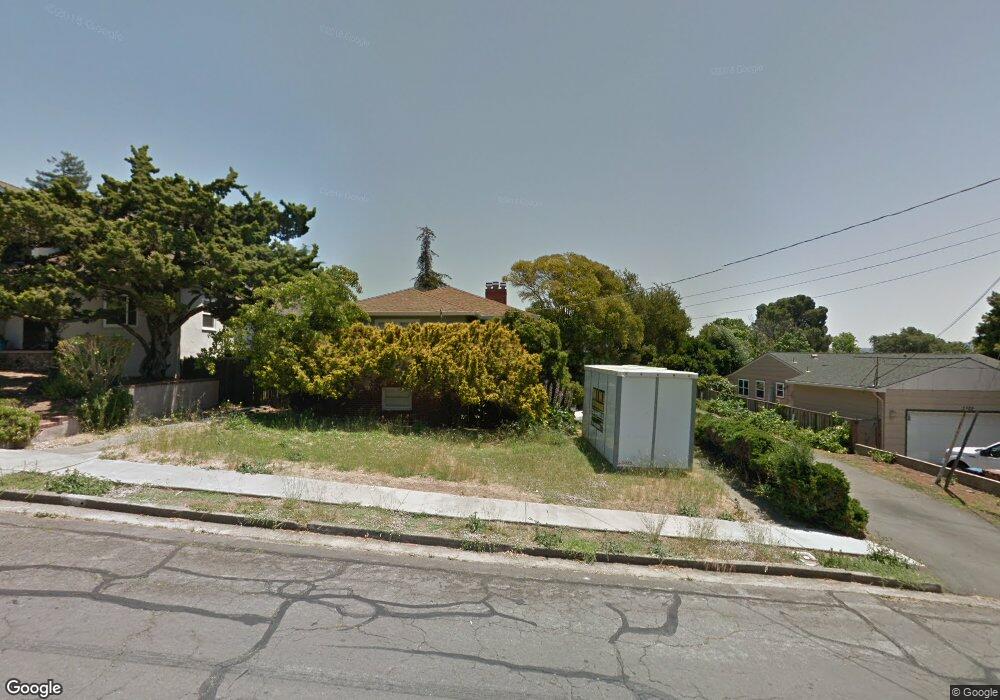
1330 E 3rd St Benicia, CA 94510
Estimated Value: $838,787 - $994,000
3
Beds
2
Baths
2,143
Sq Ft
$419/Sq Ft
Est. Value
About This Home
This home is located at 1330 E 3rd St, Benicia, CA 94510 and is currently estimated at $898,447, approximately $419 per square foot. 1330 E 3rd St is a home located in Solano County with nearby schools including Robert Semple Elementary School, Benicia Middle School, and Benicia High School.
Ownership History
Date
Name
Owned For
Owner Type
Purchase Details
Closed on
Feb 13, 2024
Sold by
Karen S Burns Living Trust
Bought by
Robert Burns Foundation
Current Estimated Value
Purchase Details
Closed on
Feb 10, 2009
Sold by
Burns Karen S
Bought by
Burns Karen S
Purchase Details
Closed on
Jun 7, 1994
Sold by
Stahl Donald
Bought by
Burns Karen S
Home Financials for this Owner
Home Financials are based on the most recent Mortgage that was taken out on this home.
Original Mortgage
$67,500
Interest Rate
8.56%
Create a Home Valuation Report for This Property
The Home Valuation Report is an in-depth analysis detailing your home's value as well as a comparison with similar homes in the area
Home Values in the Area
Average Home Value in this Area
Purchase History
| Date | Buyer | Sale Price | Title Company |
|---|---|---|---|
| Robert Burns Foundation | -- | None Listed On Document | |
| Burns Karen S | -- | None Available | |
| Burns Karen S | $90,000 | North American Title Company |
Source: Public Records
Mortgage History
| Date | Status | Borrower | Loan Amount |
|---|---|---|---|
| Previous Owner | Burns Karen S | $67,500 |
Source: Public Records
Tax History
| Year | Tax Paid | Tax Assessment Tax Assessment Total Assessment is a certain percentage of the fair market value that is determined by local assessors to be the total taxable value of land and additions on the property. | Land | Improvement |
|---|---|---|---|---|
| 2025 | $903 | $805,800 | $239,700 | $566,100 |
| 2024 | $903 | $74,612 | $14,354 | $60,258 |
| 2023 | $881 | $73,150 | $14,073 | $59,077 |
| 2022 | $865 | $71,717 | $13,798 | $57,919 |
| 2021 | $848 | $70,312 | $13,528 | $56,784 |
| 2020 | $836 | $69,592 | $13,390 | $56,202 |
| 2019 | $822 | $68,228 | $13,128 | $55,100 |
| 2018 | $801 | $66,891 | $12,871 | $54,020 |
| 2017 | $783 | $65,580 | $12,619 | $52,961 |
| 2016 | $779 | $64,295 | $12,372 | $51,923 |
| 2015 | $760 | $63,331 | $12,187 | $51,144 |
| 2014 | $751 | $62,092 | $11,949 | $50,143 |
Source: Public Records
Map
Nearby Homes
Your Personal Tour Guide
Ask me questions while you tour the home.