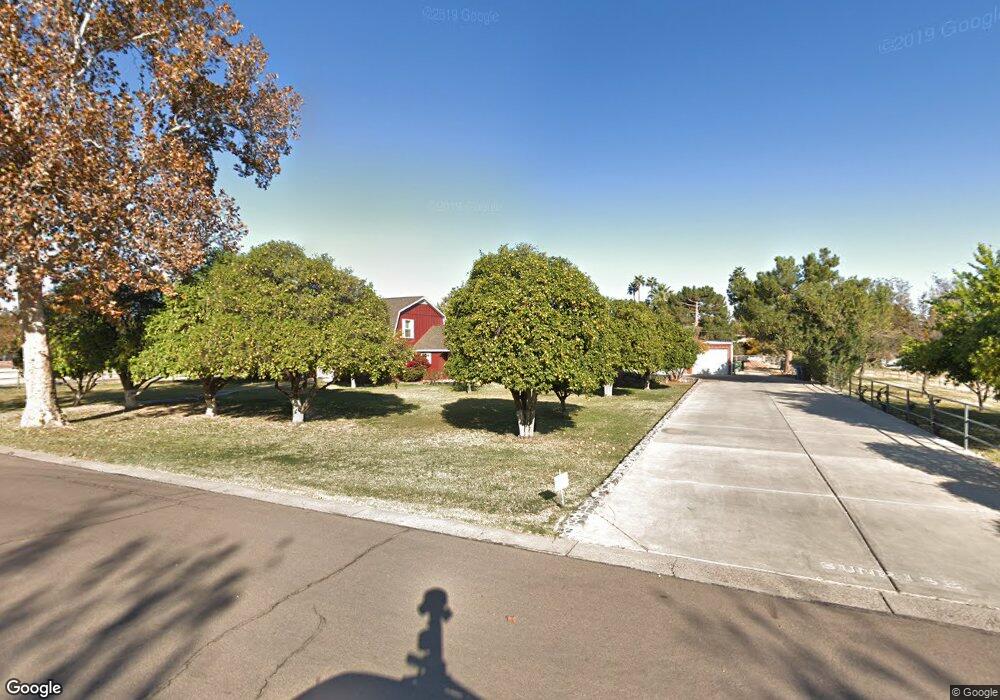
1330 E Calle de Caballos Tempe, AZ 85284
South Tempe NeighborhoodEstimated Value: $1,138,267 - $1,334,000
--
Bed
3
Baths
2,840
Sq Ft
$431/Sq Ft
Est. Value
About This Home
This home is located at 1330 E Calle de Caballos, Tempe, AZ 85284 and is currently estimated at $1,223,567, approximately $430 per square foot. 1330 E Calle de Caballos is a home located in Maricopa County with nearby schools including C I Waggoner School, Kyrene Middle School, and Corona Del Sol High School.
Ownership History
Date
Name
Owned For
Owner Type
Purchase Details
Closed on
Nov 13, 2013
Sold by
Sahakian Diane Elise
Bought by
Sahakian Diane Elise and Sahakian Family Trust
Current Estimated Value
Purchase Details
Closed on
Apr 13, 2000
Sold by
Brooke Bill T and Brooke Edna Mae
Bought by
Sahaklan Diane E
Purchase Details
Closed on
Dec 23, 1997
Sold by
Brooke Bill T and Brooke Edna Mae
Bought by
Brooke Bill T and Brooke Edna Mae
Purchase Details
Closed on
Oct 2, 1997
Sold by
Sunrise Unlimited Inc
Bought by
Brooke Bill T and Brooke Edna Mae
Purchase Details
Closed on
Apr 30, 1997
Sold by
Brooke Bill T and Brooke Edna Mae
Bought by
Brooke Bill T and Brooke Edna Mae
Purchase Details
Closed on
Dec 31, 1996
Sold by
Sunrise Unlimited Inc and Brooke Nevi H
Bought by
Hal Bro Enterprises Inc
Create a Home Valuation Report for This Property
The Home Valuation Report is an in-depth analysis detailing your home's value as well as a comparison with similar homes in the area
Home Values in the Area
Average Home Value in this Area
Purchase History
| Date | Buyer | Sale Price | Title Company |
|---|---|---|---|
| Sahakian Diane Elise | -- | None Available | |
| Sahaklan Diane E | $520,000 | Fidelity National Title | |
| Brooke Bill T | -- | -- | |
| Brooke Bill T | -- | Transnation Title Insurance | |
| Brooke Bill T | -- | -- | |
| Hal Bro Enterprises Inc | -- | First American Title |
Source: Public Records
Tax History Compared to Growth
Tax History
| Year | Tax Paid | Tax Assessment Tax Assessment Total Assessment is a certain percentage of the fair market value that is determined by local assessors to be the total taxable value of land and additions on the property. | Land | Improvement |
|---|---|---|---|---|
| 2025 | $3,469 | $37,132 | -- | -- |
| 2024 | $3,272 | $35,363 | -- | -- |
| 2023 | $3,272 | $85,430 | $17,080 | $68,350 |
| 2022 | $3,102 | $63,250 | $12,650 | $50,600 |
| 2021 | $3,223 | $60,970 | $12,190 | $48,780 |
| 2020 | $3,146 | $56,880 | $11,370 | $45,510 |
| 2019 | $3,046 | $45,830 | $9,160 | $36,670 |
| 2018 | $2,944 | $41,460 | $8,290 | $33,170 |
| 2017 | $2,822 | $26,510 | $5,300 | $21,210 |
| 2016 | $2,862 | $25,870 | $5,170 | $20,700 |
| 2015 | $2,644 | $25,930 | $5,180 | $20,750 |
Source: Public Records
Map
Nearby Homes
- 8606 S Dorsey Ln
- 8629 S Stanley Place
- 1454 E Calle de Arcos
- 1129 E Knight Ln
- 7745 S Juniper St
- 1809 E Carver Rd
- 935 E Citation Ln
- 938 E Knight Ln
- 1830 E Secretariat Dr
- 929 E Derby Dr
- 1060 E Louis Way Unit 14
- 7716 S Rita Ln Unit 3
- 1444 E Myrna Ln
- 1101 E Warner Rd Unit 117
- 8856 S Taylor Dr
- 1070 E Sunburst Ln
- 1938 E Calle de Caballos
- 7681 S Bonarden Ln
- 11812 S 71st St
- 1444 E Mcnair Dr
- 1441 E Calle de Caballos
- 1315 E Calle de Caballos
- 1339 E Calle de Caballos
- 1350 E Calle de Caballos
- 1307 E Calle de Caballos
- 1408 E Calle de Caballos
- 1424 E Calle de Caballos
- 1459 E Calle de Caballos
- 1409 E Calle de Caballos
- 1440 E Calle de Caballos
- 1420 E Calle de Caballos
- 8405 S Newberry Ln
- 1334 E Palomino Dr
- 8231 S Terrace Rd Unit C
- 1356 E Palomino Dr
- 1346 E Palomino Dr
- 1402 E Palomino Dr
- 1302 E Palomino Dr
- 1456 E Calle de Caballos
- 1408 E Palomino Dr