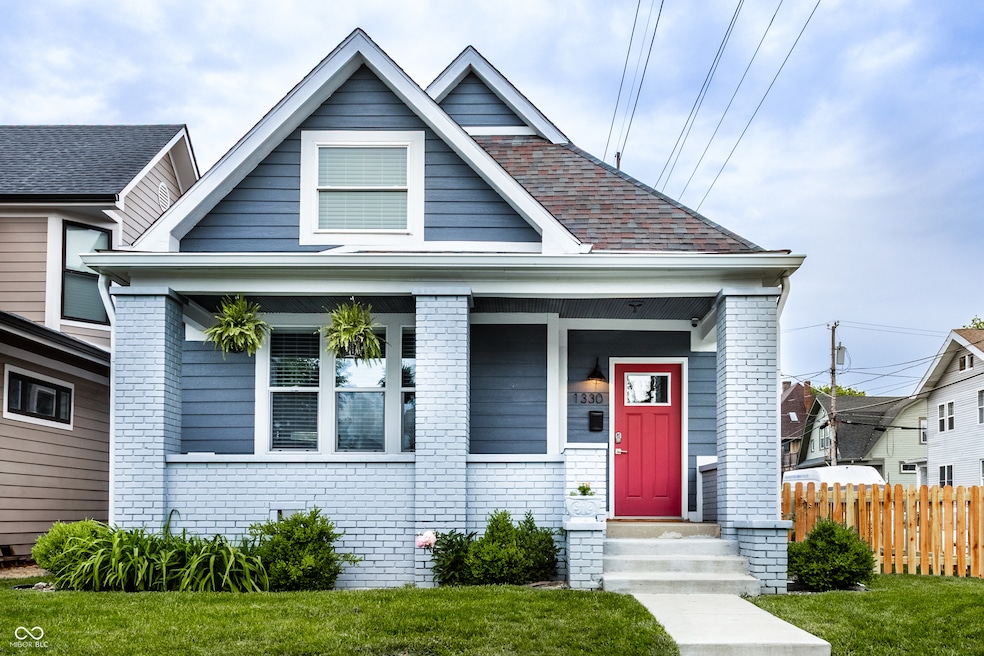


1330 Marlowe Ave Indianapolis, IN 46202
Holy Cross NeighborhoodEstimated payment $2,783/month
Highlights
- Deck
- High Ceiling
- Covered Patio or Porch
- Traditional Architecture
- No HOA
- 2-minute walk to Highland Park Playground
About This Home
Welcome to the incredible, amazing, jaw dropping.....Holy Cross Neighborhood! This 3 bed, 2.5 bath 2,800 square feet stunner is just one block away from Highland Park and was taken down to the studs a few years ago and brought back even better. Need room to spread out? It has multiple living rooms, soaring ceilings, oversized bedrooms, a dreamy front room for a formal dining room or the office of your dreams. A bonus? A dual HVAC system keeps both floors comfy (a total win in Indy). Step outside to a concrete patio or head up to the second-story deck for skyline views that actually deliver. How about some storage? How about a 1,500 sqft basement ready for all your extras.
Home Details
Home Type
- Single Family
Est. Annual Taxes
- $8,870
Year Built
- Built in 1910 | Remodeled
Lot Details
- 3,180 Sq Ft Lot
Home Design
- Traditional Architecture
- Brick Foundation
- Wood Siding
Interior Spaces
- 2-Story Property
- Bar Fridge
- High Ceiling
- Non-Functioning Fireplace
- Entrance Foyer
- Combination Kitchen and Dining Room
- Unfinished Basement
Kitchen
- Eat-In Kitchen
- Electric Oven
- Microwave
- Dishwasher
- Kitchen Island
- Disposal
Flooring
- Carpet
- Vinyl Plank
Bedrooms and Bathrooms
- 3 Bedrooms
- Walk-In Closet
Laundry
- Laundry on upper level
- Dryer
- Washer
Home Security
- Smart Locks
- Fire and Smoke Detector
Outdoor Features
- Deck
- Covered Patio or Porch
Utilities
- Two cooling system units
- Forced Air Heating and Cooling System
- Heating System Uses Natural Gas
- Tankless Water Heater
Community Details
- No Home Owners Association
Listing and Financial Details
- Tax Lot L13
- Assessor Parcel Number 491006124070000101
Map
Home Values in the Area
Average Home Value in this Area
Tax History
| Year | Tax Paid | Tax Assessment Tax Assessment Total Assessment is a certain percentage of the fair market value that is determined by local assessors to be the total taxable value of land and additions on the property. | Land | Improvement |
|---|---|---|---|---|
| 2024 | $4,265 | $370,000 | $35,100 | $334,900 |
| 2023 | $4,265 | $176,100 | $35,100 | $141,000 |
| 2022 | $4,199 | $174,200 | $35,100 | $139,100 |
| 2021 | $3,701 | $156,800 | $35,100 | $121,700 |
| 2020 | $2,118 | $87,900 | $15,600 | $72,300 |
| 2019 | $2,033 | $0 | $0 | $0 |
| 2018 | $282 | $73,800 | $15,600 | $58,200 |
| 2017 | $204 | $66,400 | $15,600 | $50,800 |
| 2016 | $154 | $60,000 | $15,600 | $44,400 |
| 2014 | $1,368 | $64,200 | $15,600 | $48,600 |
| 2013 | $1,258 | $61,000 | $15,600 | $45,400 |
Property History
| Date | Event | Price | List to Sale | Price per Sq Ft | Prior Sale |
|---|---|---|---|---|---|
| 11/14/2025 11/14/25 | For Rent | $2,800 | 0.0% | -- | |
| 08/19/2025 08/19/25 | Price Changed | $389,000 | -2.7% | $141 / Sq Ft | |
| 07/11/2025 07/11/25 | Price Changed | $399,900 | -3.6% | $145 / Sq Ft | |
| 05/30/2025 05/30/25 | Price Changed | $415,000 | -2.4% | $150 / Sq Ft | |
| 05/01/2025 05/01/25 | For Sale | $425,000 | +10.4% | $154 / Sq Ft | |
| 10/25/2023 10/25/23 | Sold | $385,000 | -3.5% | $139 / Sq Ft | View Prior Sale |
| 09/26/2023 09/26/23 | Pending | -- | -- | -- | |
| 07/13/2023 07/13/23 | For Sale | $399,000 | +3.6% | $144 / Sq Ft | |
| 07/12/2023 07/12/23 | Off Market | $385,000 | -- | -- | |
| 06/02/2023 06/02/23 | Price Changed | $399,000 | -4.8% | $144 / Sq Ft | |
| 05/09/2023 05/09/23 | Price Changed | $419,000 | -4.6% | $151 / Sq Ft | |
| 04/29/2023 04/29/23 | Price Changed | $439,000 | -2.4% | $159 / Sq Ft | |
| 04/17/2023 04/17/23 | Price Changed | $449,900 | -4.1% | $163 / Sq Ft | |
| 04/06/2023 04/06/23 | For Sale | $469,000 | +120.7% | $169 / Sq Ft | |
| 04/09/2021 04/09/21 | Sold | $212,500 | -7.6% | $57 / Sq Ft | View Prior Sale |
| 02/27/2021 02/27/21 | Pending | -- | -- | -- | |
| 02/11/2021 02/11/21 | For Sale | $229,900 | 0.0% | $61 / Sq Ft | |
| 02/04/2021 02/04/21 | Pending | -- | -- | -- | |
| 02/01/2021 02/01/21 | For Sale | $229,900 | -- | $61 / Sq Ft |
Purchase History
| Date | Type | Sale Price | Title Company |
|---|---|---|---|
| Warranty Deed | -- | None Listed On Document | |
| Quit Claim Deed | -- | None Listed On Document | |
| Quit Claim Deed | -- | None Listed On Document | |
| Warranty Deed | -- | Security Title | |
| Interfamily Deed Transfer | -- | -- | |
| Interfamily Deed Transfer | -- | None Available | |
| Interfamily Deed Transfer | -- | None Available |
Mortgage History
| Date | Status | Loan Amount | Loan Type |
|---|---|---|---|
| Open | $245,000 | New Conventional | |
| Previous Owner | $162,500 | New Conventional |
Source: MIBOR Broker Listing Cooperative®
MLS Number: 22035852
APN: 49-10-06-124-070.000-101
Disclaimer: Certain information contained herein is derived from information provided by parties other than Homes.com. All information provided is deemed reliable, but is not guaranteed to be accurate and should be independently verified.
![]() Based on information submitted to the MLS GRID. All data is obtained from various sources and may not have been verified by broker or MLS GRID. Supplied Open House Information is subject to change without notice. All information should be independently reviewed and verified for accuracy. Properties may or may not be listed by the office/agent presenting the information. Some IDX listings have been excluded from this website.
Based on information submitted to the MLS GRID. All data is obtained from various sources and may not have been verified by broker or MLS GRID. Supplied Open House Information is subject to change without notice. All information should be independently reviewed and verified for accuracy. Properties may or may not be listed by the office/agent presenting the information. Some IDX listings have been excluded from this website.
- 1523 Marlowe Ave
- 1401 Marlowe Ave
- 1329 Marlowe Ave
- 1405 Marlowe Ave
- 1308 Marlowe Ave
- 1421 E New York St
- 207 N Arsenal Ave
- 1205 Sturm Ave
- 425 N Arsenal Ave
- 1229 E Market St
- 1601 E Ohio St
- 1610 E Ohio St
- 234 N State Ave
- 1417 E Michigan St
- 1618 E Market St
- 121 N State Ave
- 452 N State Ave
- 141 Herman St
- 29 N State Ave
- 1629 E Michigan St
- 1230 E Ohio St Unit B
- 216 N Summit St Unit B
- 1117 E Market St
- 1301 E Washington St
- 405 N State Ave Unit ID1266063P
- 1603 E Michigan St Unit 1603
- 37 N Randolph St
- 17 N Randolph St
- 143 Mckim Ave
- 22 Hendricks Place Unit 22
- 430 Spring St
- 1118 E Saint Clair St
- 312 N College Ave
- 740 E North St
- 590 Woodruff Place Dr E
- 721 E North St Unit 1C
- 403 N Hamilton Ave
- 619 Vermont Place
- 640 E Michigan St
- 617 N College Ave
