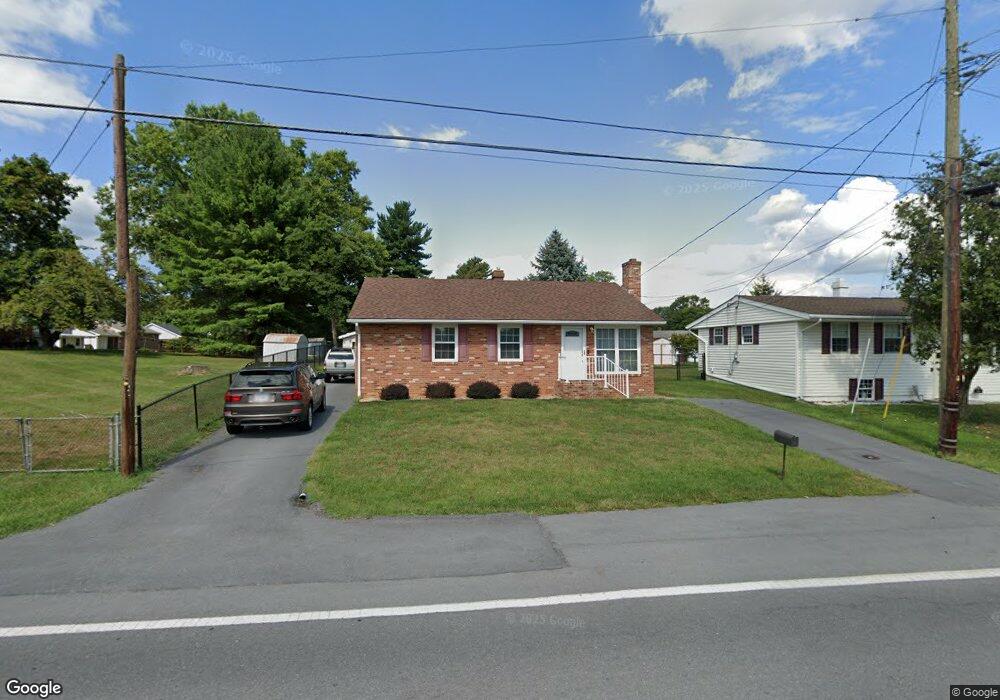
1330 Whittier Ave Winchester, VA 22601
Estimated Value: $263,000 - $328,839
4
Beds
1
Bath
1,092
Sq Ft
$273/Sq Ft
Est. Value
About This Home
This home is located at 1330 Whittier Ave, Winchester, VA 22601 and is currently estimated at $298,460, approximately $273 per square foot. 1330 Whittier Ave is a home located in Winchester City with nearby schools including Daniel Morgan Middle School, John Handley High School, and Sacred Heart Academy.
Ownership History
Date
Name
Owned For
Owner Type
Purchase Details
Closed on
Aug 19, 2022
Sold by
Burleson David A and Burleson Patricia L
Bought by
Kirby Cheryl
Current Estimated Value
Purchase Details
Closed on
Sep 4, 2015
Sold by
Vipperman Joan A
Bought by
Burleson David A and Burleson Patricia L
Home Financials for this Owner
Home Financials are based on the most recent Mortgage that was taken out on this home.
Original Mortgage
$73,600
Interest Rate
4.07%
Mortgage Type
Credit Line Revolving
Create a Home Valuation Report for This Property
The Home Valuation Report is an in-depth analysis detailing your home's value as well as a comparison with similar homes in the area
Home Values in the Area
Average Home Value in this Area
Purchase History
| Date | Buyer | Sale Price | Title Company |
|---|---|---|---|
| Kirby Cheryl | $289,000 | Hutchinson Gregory F | |
| Burleson David A | $92,000 | Old Republic Natl Title Ins |
Source: Public Records
Mortgage History
| Date | Status | Borrower | Loan Amount |
|---|---|---|---|
| Previous Owner | Burleson David A | $73,600 |
Source: Public Records
Tax History Compared to Growth
Tax History
| Year | Tax Paid | Tax Assessment Tax Assessment Total Assessment is a certain percentage of the fair market value that is determined by local assessors to be the total taxable value of land and additions on the property. | Land | Improvement |
|---|---|---|---|---|
| 2025 | $1,965 | $247,159 | $52,500 | $194,659 |
| 2024 | $1,836 | $221,259 | $52,500 | $168,759 |
| 2023 | $1,836 | $221,259 | $52,500 | $168,759 |
| 2022 | $1,535 | $165,000 | $52,500 | $112,500 |
| 2021 | $1,535 | $165,000 | $52,500 | $112,500 |
| 2020 | $1,328 | $142,800 | $52,500 | $90,300 |
| 2019 | $1,328 | $142,800 | $52,500 | $90,300 |
| 2018 | $1,259 | $138,400 | $52,500 | $85,900 |
| 2017 | $1,218 | $138,400 | $52,500 | $85,900 |
| 2016 | $1,218 | $133,900 | $52,500 | $81,400 |
| 2015 | $1,218 | $133,900 | $52,500 | $81,400 |
| 2014 | $1,127 | $118,600 | $52,500 | $66,100 |
Source: Public Records
Map
Nearby Homes
- 312 Fox Dr
- 339 Lanny Dr
- 341 Wood Ave
- 509 Marion St
- 1625 Amherst St
- 1721 Amherst St
- 1814 Blythe Way
- 1810 Blythe Way
- 1819 Reese Ct
- 1802 Blythe Way
- 1822 Blythe Way
- 1818 Blythe Way
- 110 Clevenger Ct
- 163 Margaret Ln
- 792 Fox Dr
- 127 Shirley St
- 506 Fairmont Ave
- 420 Westside Station Dr
- 801 Fairmont Ave
- 428 Westside Station Dr