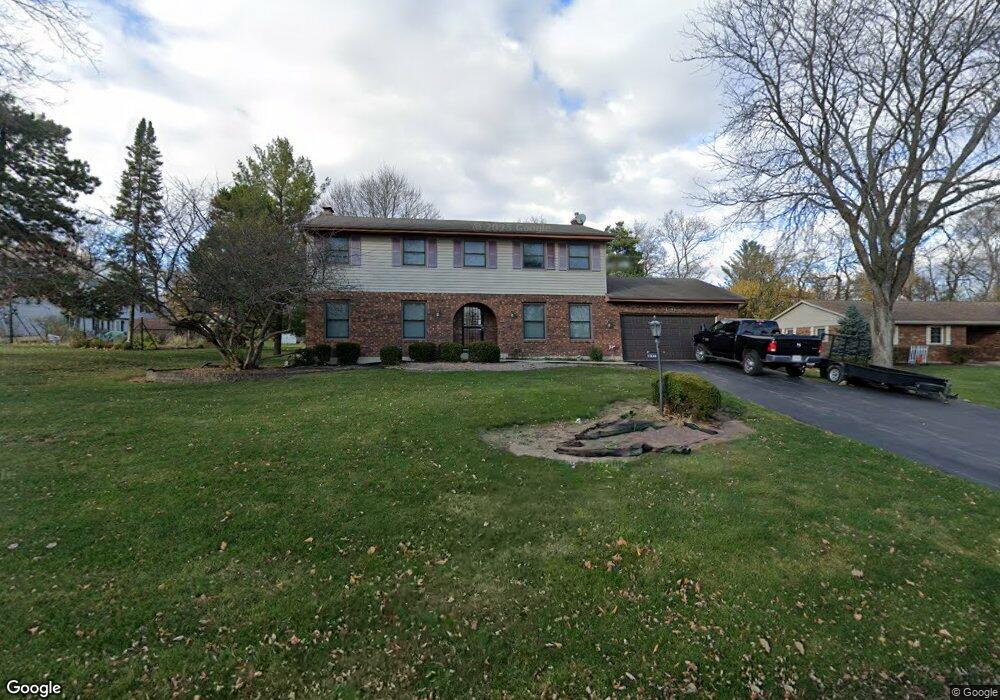
1330 Zange Dr Algonquin, IL 60102
Estimated Value: $395,453 - $484,000
4
Beds
3
Baths
2,445
Sq Ft
$178/Sq Ft
Est. Value
About This Home
This home is located at 1330 Zange Dr, Algonquin, IL 60102 and is currently estimated at $436,113, approximately $178 per square foot. 1330 Zange Dr is a home located in McHenry County with nearby schools including Westfield Community School, Kenneth E Neubert Elementary School, and United Junior High School.
Ownership History
Date
Name
Owned For
Owner Type
Purchase Details
Closed on
Sep 2, 2004
Sold by
Romane Gene and Romane Betty A
Bought by
Romane Betty A and Romane Family Trust Agreement
Current Estimated Value
Purchase Details
Closed on
Jul 8, 2003
Sold by
Knebl John J and Knebl Shelley L
Bought by
Romane Gene and Romane Betty A
Home Financials for this Owner
Home Financials are based on the most recent Mortgage that was taken out on this home.
Original Mortgage
$70,000
Outstanding Balance
$29,985
Interest Rate
5.36%
Mortgage Type
Unknown
Estimated Equity
$406,128
Purchase Details
Closed on
Jul 22, 1999
Sold by
Yonka Gary A and Yonka Kathryn A
Bought by
Knebl John J and Knebl Shelley L
Home Financials for this Owner
Home Financials are based on the most recent Mortgage that was taken out on this home.
Original Mortgage
$209,254
Interest Rate
7.54%
Mortgage Type
FHA
Create a Home Valuation Report for This Property
The Home Valuation Report is an in-depth analysis detailing your home's value as well as a comparison with similar homes in the area
Home Values in the Area
Average Home Value in this Area
Purchase History
| Date | Buyer | Sale Price | Title Company |
|---|---|---|---|
| Romane Betty A | -- | -- | |
| Romane Gene | $265,500 | Ticor | |
| Knebl John J | $211,000 | Chicago Title |
Source: Public Records
Mortgage History
| Date | Status | Borrower | Loan Amount |
|---|---|---|---|
| Open | Romane Gene | $70,000 | |
| Previous Owner | Knebl John J | $209,254 |
Source: Public Records
Tax History Compared to Growth
Tax History
| Year | Tax Paid | Tax Assessment Tax Assessment Total Assessment is a certain percentage of the fair market value that is determined by local assessors to be the total taxable value of land and additions on the property. | Land | Improvement |
|---|---|---|---|---|
| 2024 | $8,015 | $118,455 | $13,285 | $105,170 |
| 2023 | $7,529 | $105,943 | $11,882 | $94,061 |
| 2022 | $7,611 | $99,750 | $33,485 | $66,265 |
| 2021 | $7,270 | $92,929 | $31,195 | $61,734 |
| 2020 | $7,061 | $89,640 | $30,091 | $59,549 |
| 2019 | $6,868 | $85,797 | $28,801 | $56,996 |
| 2018 | $6,822 | $87,645 | $26,606 | $61,039 |
| 2017 | $7,127 | $82,568 | $25,065 | $57,503 |
| 2016 | $6,987 | $77,442 | $23,509 | $53,933 |
| 2013 | -- | $80,755 | $21,930 | $58,825 |
Source: Public Records
Map
Nearby Homes
- 1 N Hubbard St
- SWC Talaga and Algonquin Rd
- 700 Fairfield Ln
- 1820 Crofton Dr
- 1235 Fairmont Ct
- 741 Regal Ln
- 721 Brentwood Ct
- 661 Majestic Dr
- 266 Grandview Ct
- 2235 Dawson Ln
- 710 Sprucetree Ln
- 16 Brian Ct
- 305 Buckingham Dr
- 909 Roger St
- 2161 Burnham Ct
- 135 Arquilla Dr
- 1971 Peach Tree Ln
- 102 Center St
- 2043 Peach Tree Ln Unit 4122
- 000 County Line Rd
- 1320 Zange Dr
- 723 W Surrey Ln Unit 5
- 743 W Surrey Ln
- 1310 Zange Dr
- 713 W Surrey Ln
- 1325 Zange Dr
- 1315 Zange Dr
- 1300 Zange Dr
- 703 W Surrey Ln
- 1311 Lexington Dr
- 1321 Lexington Dr Unit 5
- 1305 Zange Dr
- 1331 Lexington Dr
- 803 Surrey Ln
- 1240 Zange Dr
- 653 W Surrey Ln
- 1245 Zange Dr
- 732 W Surrey Ln
- 1301 Lexington Dr
- 742 W Surrey Ln