Estimated Value: $864,000 - $1,014,000
4
Beds
2
Baths
1,212
Sq Ft
$756/Sq Ft
Est. Value
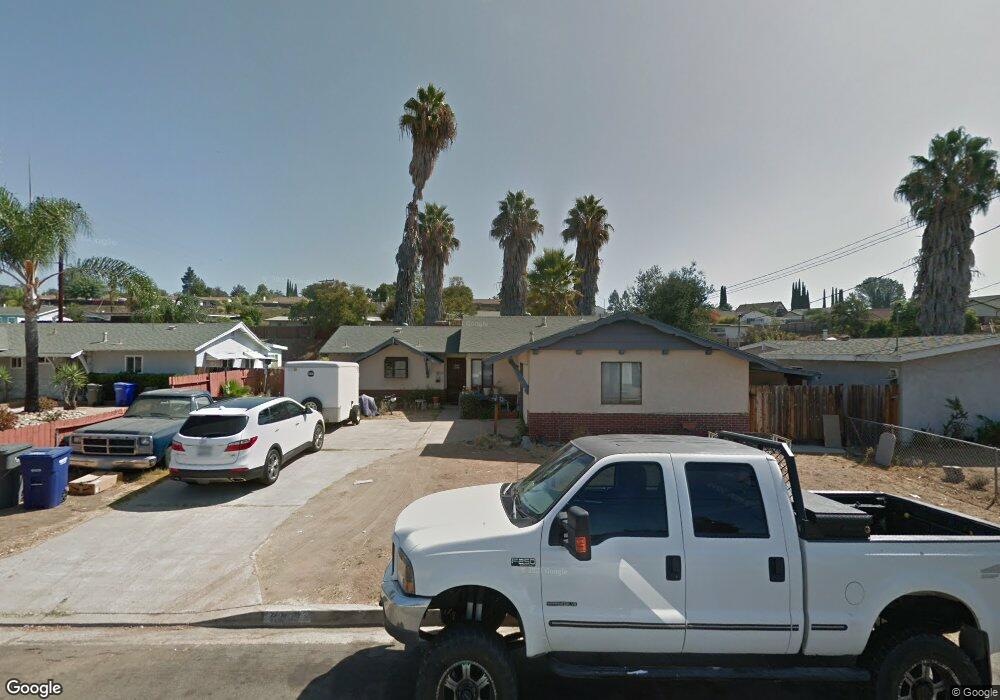
About This Home
This home is located at 13309 Powers Rd, Poway, CA 92064 and is currently estimated at $915,975, approximately $755 per square foot. 13309 Powers Rd is a home located in San Diego County with nearby schools including Pomerado Elementary, Meadowbrook Middle, and Poway High.
Ownership History
Date
Name
Owned For
Owner Type
Purchase Details
Closed on
Oct 10, 2025
Sold by
Blake Blanca
Bought by
Blanca Blake Living Trust and Blake
Current Estimated Value
Purchase Details
Closed on
Nov 1, 2021
Sold by
Blake Blanca X and Estill Mary H
Bought by
Blake Blanca X
Home Financials for this Owner
Home Financials are based on the most recent Mortgage that was taken out on this home.
Original Mortgage
$551,401
Interest Rate
3.01%
Mortgage Type
New Conventional
Purchase Details
Closed on
Mar 5, 2020
Sold by
Wong Peter and Wong Christine
Bought by
Blake Blanca X and Estill Mary H
Home Financials for this Owner
Home Financials are based on the most recent Mortgage that was taken out on this home.
Original Mortgage
$435,100
Interest Rate
3.4%
Mortgage Type
New Conventional
Purchase Details
Closed on
Oct 18, 1989
Bought by
Wong Peter Christine A
Create a Home Valuation Report for This Property
The Home Valuation Report is an in-depth analysis detailing your home's value as well as a comparison with similar homes in the area
Home Values in the Area
Average Home Value in this Area
Purchase History
| Date | Buyer | Sale Price | Title Company |
|---|---|---|---|
| Blanca Blake Living Trust | -- | None Listed On Document | |
| Blake Blanca X | -- | First American Title Company | |
| Blake Blanca X | $458,000 | Corinthian Title Company | |
| Wong Peter Christine A | $156,900 | -- |
Source: Public Records
Mortgage History
| Date | Status | Borrower | Loan Amount |
|---|---|---|---|
| Previous Owner | Blake Blanca X | $551,401 | |
| Previous Owner | Blake Blanca X | $435,100 |
Source: Public Records
Tax History
| Year | Tax Paid | Tax Assessment Tax Assessment Total Assessment is a certain percentage of the fair market value that is determined by local assessors to be the total taxable value of land and additions on the property. | Land | Improvement |
|---|---|---|---|---|
| 2025 | $6,738 | $611,249 | $366,420 | $244,829 |
| 2024 | $6,738 | $599,265 | $359,236 | $240,029 |
| 2023 | $6,595 | $587,516 | $352,193 | $235,323 |
| 2022 | $5,318 | $471,996 | $210,577 | $261,419 |
| 2021 | $5,248 | $462,743 | $206,449 | $256,294 |
| 2020 | $2,992 | $263,914 | $117,743 | $146,171 |
| 2019 | $2,915 | $258,740 | $115,435 | $143,305 |
| 2018 | $2,833 | $253,668 | $113,172 | $140,496 |
| 2017 | $170 | $248,695 | $110,953 | $137,742 |
| 2016 | $2,700 | $243,820 | $108,778 | $135,042 |
| 2015 | $2,660 | $240,159 | $107,145 | $133,014 |
| 2014 | $2,599 | $235,456 | $105,047 | $130,409 |
Source: Public Records
Map
Nearby Homes
- 13254 Powers Ct
- 12450 Robison Blvd
- 12614 Orohaven Ln
- 13442 Mountainside Dr
- 12719 Robison Blvd Unit 18
- 12739 Papago Dr
- 12717 Harmon Rd
- 12741 Liberty Way
- 12851 Papago Dr
- 13824 Powers Rd
- 12665 Oak Knoll Rd
- 12953 Carriage Rd
- 12701 Oak Knoll Rd
- 12709 Oak Knoll Rd
- 13641 Carriage Rd
- 12608 Tustin St
- 12811 Beeler Creek Trail
- 12939 Cree Ct
- 0 Dorathea Terrace
- 13085 Olympus Cir Unit 1
- 13315 Powers Rd
- 13303 Powers Rd
- 13310 Frame Rd
- 13321 Powers Rd
- 13316 Frame Rd
- 13304 Frame Rd
- 13308 Powers Rd
- 13314 Powers Rd
- 13302 Powers Rd
- 13322 Frame Rd
- 13271 Powers Ct
- 13327 Powers Rd
- 13320 Powers Rd
- 13328 Frame Rd
- 13270 Powers Ct
- 13265 Powers Ct
- 13326 Powers Rd
- 13234 Frame Ct
- 13333 Powers Rd
- 13311 Frame Rd
Your Personal Tour Guide
Ask me questions while you tour the home.