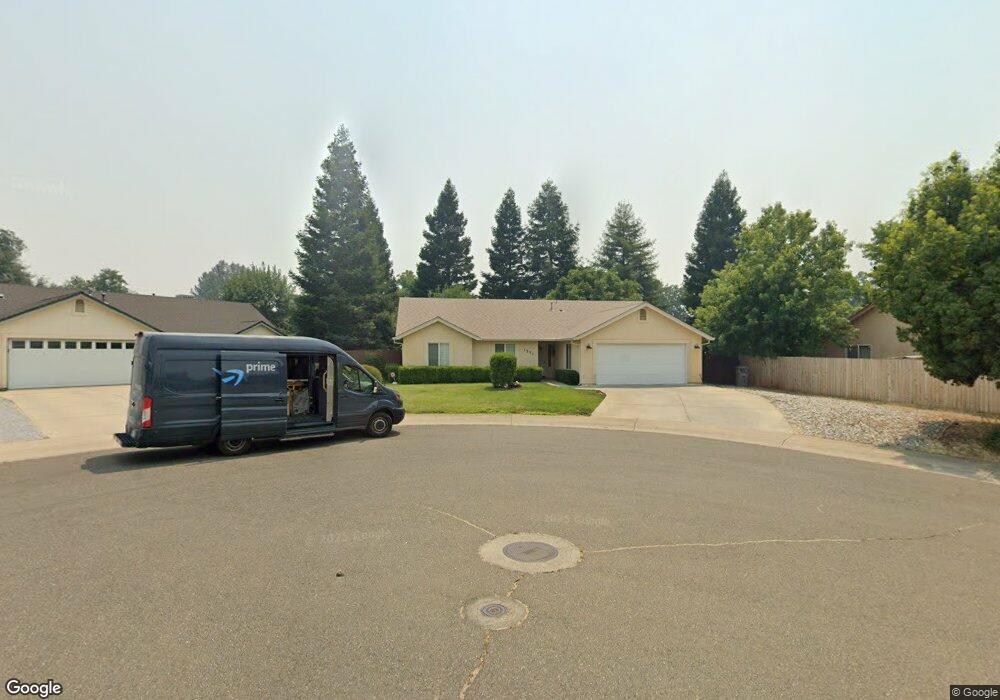
1335 Hermitage Ct Redding, CA 96002
Enterprise NeighborhoodEstimated Value: $369,895 - $402,000
3
Beds
2
Baths
1,400
Sq Ft
$272/Sq Ft
Est. Value
About This Home
This home is located at 1335 Hermitage Ct, Redding, CA 96002 and is currently estimated at $380,224, approximately $271 per square foot. 1335 Hermitage Ct is a home located in Shasta County with nearby schools including Rother Elementary School, Parsons Junior High School, and Enterprise High School.
Ownership History
Date
Name
Owned For
Owner Type
Purchase Details
Closed on
Dec 21, 2023
Sold by
Nancy C Wharton Living Trust and Allen Richard
Bought by
Gregory Todd Wharton Living Trust and Wharton
Current Estimated Value
Purchase Details
Closed on
Aug 9, 2018
Sold by
Wharton Nancy C
Bought by
Wharton Nancy C and The Nancy C Wharton Living Tru
Purchase Details
Closed on
Nov 13, 2001
Sold by
Gray Development Corp
Bought by
Wharton James F and Wharton Nancy C
Home Financials for this Owner
Home Financials are based on the most recent Mortgage that was taken out on this home.
Original Mortgage
$100,000
Interest Rate
6.51%
Create a Home Valuation Report for This Property
The Home Valuation Report is an in-depth analysis detailing your home's value as well as a comparison with similar homes in the area
Home Values in the Area
Average Home Value in this Area
Purchase History
| Date | Buyer | Sale Price | Title Company |
|---|---|---|---|
| Gregory Todd Wharton Living Trust | -- | None Listed On Document | |
| Wharton Nancy C | -- | None Available | |
| Wharton Nancy C | -- | None Available | |
| Wharton James F | $144,000 | Chicago Title Co |
Source: Public Records
Mortgage History
| Date | Status | Borrower | Loan Amount |
|---|---|---|---|
| Previous Owner | Wharton James F | $100,000 |
Source: Public Records
Tax History
| Year | Tax Paid | Tax Assessment Tax Assessment Total Assessment is a certain percentage of the fair market value that is determined by local assessors to be the total taxable value of land and additions on the property. | Land | Improvement |
|---|---|---|---|---|
| 2025 | $3,761 | $346,800 | $61,200 | $285,600 |
| 2024 | $2,210 | $340,000 | $60,000 | $280,000 |
| 2023 | $2,210 | $204,165 | $49,685 | $154,480 |
| 2022 | $2,146 | $200,162 | $48,711 | $151,451 |
| 2021 | $2,072 | $196,238 | $47,756 | $148,482 |
| 2020 | $2,062 | $194,227 | $47,267 | $146,960 |
| 2019 | $2,044 | $190,420 | $46,341 | $144,079 |
| 2018 | $2,019 | $186,687 | $45,433 | $141,254 |
| 2017 | $2,053 | $183,028 | $44,543 | $138,485 |
| 2016 | $1,919 | $179,440 | $43,670 | $135,770 |
| 2015 | $1,902 | $176,746 | $43,015 | $133,731 |
| 2014 | $1,887 | $173,285 | $42,173 | $131,112 |
Source: Public Records
Map
Nearby Homes
- 3293 Middleton Ln
- 1156 Echo Rd
- 3283 Middleton Ln
- 3178 Lawrence Rd
- 3703 Harrow Ct
- 1091 Del Sol Place
- 1513 Harpole Rd
- 1075 Le Brun Ln
- 952 Camino Ct
- 3466 Silverwood St
- 3425 Silverwood St
- 3527 Adams Ln
- 3428 Adams Ln
- 3341 Timbercreek Dr
- 2906 Regal Ave
- 2820 Alfreda Way
- 1209 C St
- 0 Churn Creek Rd Unit 25-496
- 0 Churn Creek Rd Unit 26-609
- 0 Churn Creek Rd Unit 25-5491
- 1305 Hermitage Ct
- 1365 Hermitage Ct
- 1332 Madewood Ln
- 1395 Hermitage Ct
- 1362 Madewood Ln
- 1398 Hermitage Ct
- 1368 Hermitage Ct
- 1392 Madewood Ln
- 3558 Meridian Dr
- 3366 Lawrence Rd
- 1338 Hermitage Ct
- 3360 Lawrence Rd
- 3493 Meridian Dr
- 3372 Lawrence Rd
- 3354 Lawrence Rd
- 3382 Lawrence Rd
- 3518 Meridian Dr
- 3598 Meridian Dr
- 1411 Woodbridge Ct
- 3348 Lawrence Rd
Your Personal Tour Guide
Ask me questions while you tour the home.