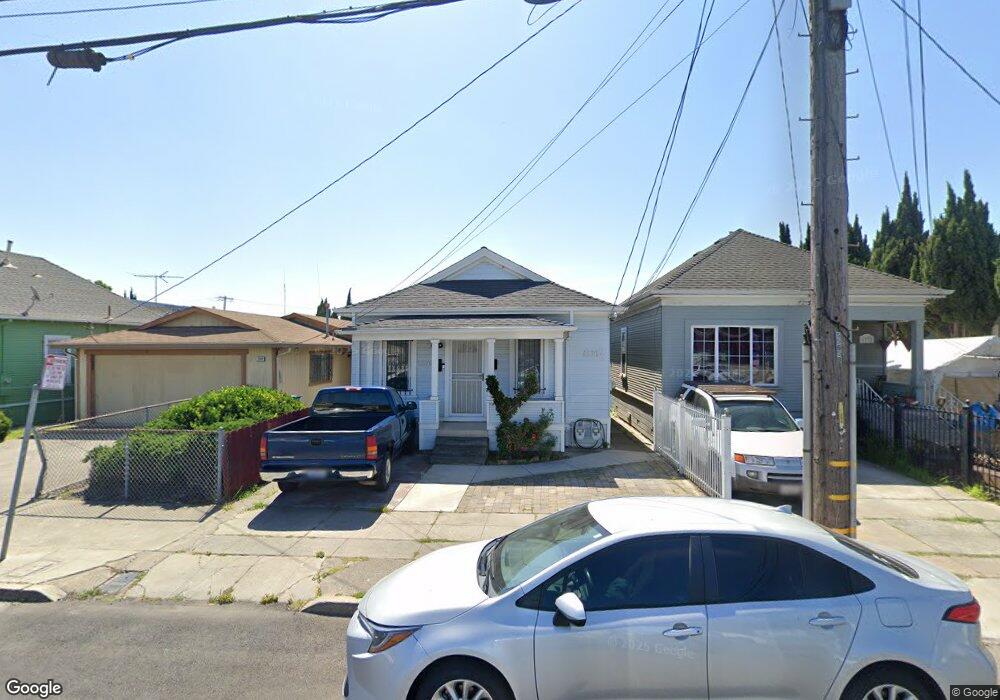
1336 53rd Ave Oakland, CA 94601
Melrose NeighborhoodEstimated Value: $501,000
3
Beds
2
Baths
1,212
Sq Ft
$413/Sq Ft
Est. Value
About This Home
This home is located at 1336 53rd Ave, Oakland, CA 94601 and is currently estimated at $501,000, approximately $413 per square foot. 1336 53rd Ave is a home located in Alameda County with nearby schools including Bridges Academy Elementary School, Greenleaf TK-8, and Coliseum College Prep Academy.
Ownership History
Date
Name
Owned For
Owner Type
Purchase Details
Closed on
May 16, 1996
Sold by
Rodriguez Arturo S
Bought by
Rodriguez Arturo S and Rodriguez Mercedes
Current Estimated Value
Home Financials for this Owner
Home Financials are based on the most recent Mortgage that was taken out on this home.
Original Mortgage
$105,000
Interest Rate
8.07%
Mortgage Type
Commercial
Create a Home Valuation Report for This Property
The Home Valuation Report is an in-depth analysis detailing your home's value as well as a comparison with similar homes in the area
Home Values in the Area
Average Home Value in this Area
Purchase History
| Date | Buyer | Sale Price | Title Company |
|---|---|---|---|
| Rodriguez Arturo S | -- | Chicago Title Co |
Source: Public Records
Mortgage History
| Date | Status | Borrower | Loan Amount |
|---|---|---|---|
| Closed | Rodriguez Arturo S | $105,000 |
Source: Public Records
Tax History Compared to Growth
Tax History
| Year | Tax Paid | Tax Assessment Tax Assessment Total Assessment is a certain percentage of the fair market value that is determined by local assessors to be the total taxable value of land and additions on the property. | Land | Improvement |
|---|---|---|---|---|
| 2025 | $5,039 | $216,436 | $64,931 | $151,505 |
| 2024 | $5,039 | $212,193 | $63,658 | $148,535 |
| 2023 | $5,150 | $208,032 | $62,409 | $145,623 |
| 2022 | $4,885 | $203,954 | $61,186 | $142,768 |
| 2021 | $4,480 | $199,955 | $59,986 | $139,969 |
| 2020 | $4,427 | $197,905 | $59,371 | $138,534 |
| 2019 | $4,139 | $194,026 | $58,208 | $135,818 |
| 2018 | $4,055 | $190,221 | $57,066 | $133,155 |
| 2017 | $3,853 | $186,492 | $55,947 | $130,545 |
| 2016 | $3,659 | $182,836 | $54,851 | $127,985 |
| 2015 | $3,636 | $180,090 | $54,027 | $126,063 |
| 2014 | $3,767 | $176,564 | $52,969 | $123,595 |
Source: Public Records
Map
Nearby Homes
