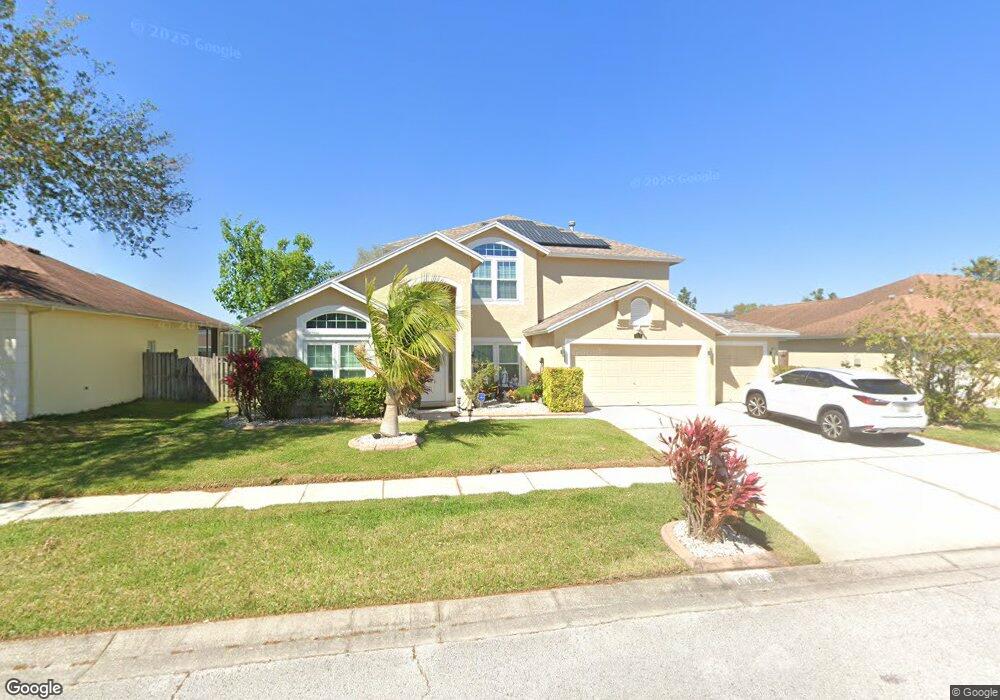
1338 Hatcher Loop Dr Brandon, FL 33511
Estimated Value: $441,286 - $518,000
5
Beds
3
Baths
2,444
Sq Ft
$193/Sq Ft
Est. Value
About This Home
This home is located at 1338 Hatcher Loop Dr, Brandon, FL 33511 and is currently estimated at $471,822, approximately $193 per square foot. 1338 Hatcher Loop Dr is a home located in Hillsborough County with nearby schools including Mintz Elementary School, Giunta Middle School, and Riverview High School.
Ownership History
Date
Name
Owned For
Owner Type
Purchase Details
Closed on
Jan 26, 2025
Sold by
Alookaran Jose and Alookaran Pauline
Bought by
Jose & Pauline Alookaran Family Trust
Current Estimated Value
Purchase Details
Closed on
Dec 15, 2001
Sold by
Clarke Fred G and Clarke M
Bought by
Alookaran Jose and Alookaran Pauline
Home Financials for this Owner
Home Financials are based on the most recent Mortgage that was taken out on this home.
Original Mortgage
$169,100
Interest Rate
6.5%
Mortgage Type
New Conventional
Purchase Details
Closed on
Dec 1, 1997
Sold by
Centex Real Estate Corp
Bought by
Clarke Fred G and Clarke Lisa M
Home Financials for this Owner
Home Financials are based on the most recent Mortgage that was taken out on this home.
Original Mortgage
$50,000
Interest Rate
7.35%
Mortgage Type
New Conventional
Create a Home Valuation Report for This Property
The Home Valuation Report is an in-depth analysis detailing your home's value as well as a comparison with similar homes in the area
Home Values in the Area
Average Home Value in this Area
Purchase History
| Date | Buyer | Sale Price | Title Company |
|---|---|---|---|
| Jose & Pauline Alookaran Family Trust | -- | None Listed On Document | |
| Alookaran Jose | $178,000 | -- | |
| Clarke Fred G | $153,600 | -- |
Source: Public Records
Mortgage History
| Date | Status | Borrower | Loan Amount |
|---|---|---|---|
| Previous Owner | Clarke Fred G | $174,500 | |
| Previous Owner | Clarke Fred G | $169,100 | |
| Previous Owner | Clarke Fred G | $50,000 |
Source: Public Records
Tax History
| Year | Tax Paid | Tax Assessment Tax Assessment Total Assessment is a certain percentage of the fair market value that is determined by local assessors to be the total taxable value of land and additions on the property. | Land | Improvement |
|---|---|---|---|---|
| 2025 | $5,935 | $143,884 | -- | -- |
| 2024 | $5,935 | $139,829 | -- | -- |
| 2023 | $5,827 | $135,756 | $0 | $0 |
| 2022 | $5,665 | $131,802 | $0 | $0 |
| 2021 | $5,640 | $127,963 | $0 | $0 |
| 2020 | $5,561 | $126,196 | $0 | $0 |
| 2019 | $5,480 | $123,359 | $0 | $0 |
| 2018 | $1,806 | $121,059 | $0 | $0 |
| 2017 | $2,005 | $222,144 | $0 | $0 |
| 2016 | $1,969 | $116,130 | $0 | $0 |
| 2015 | $1,962 | $115,323 | $0 | $0 |
| 2014 | $1,962 | $114,408 | $0 | $0 |
| 2013 | $1,962 | $112,717 | $0 | $0 |
Source: Public Records
Map
Nearby Homes
- 1221 Franford Dr
- 2234 Fluorshire Dr
- 2140 Fluorshire Dr
- 1641 Ledgestone Dr
- 1510 Attleboro Ln
- 1516 Westerly Dr
- 1341 Twilridge Place
- 1335 Twilridge Place
- 1235 Alpine Lake Dr
- 2030 Fluorshire Dr
- 1907 Fluorshire Dr
- 1001 English Bluffs Ct
- 1213 Sweet Gum Dr
- 1451 Mohrlake Dr
- 1205 Sweet Gum Dr
- 1421 Mohrlake Dr
- 1312 Foxboro Dr
- 1506 Little Brook Ln
- 732 Tradewinds Dr
- 1407 Foxboro Dr
- 1340 Hatcher Loop Dr
- 1336 Hatcher Loop Dr
- 1212 Franford Dr
- 1210 Franford Dr
- 1214 Franford Dr
- 1208 Franford Dr
- 1342 Hatcher Loop Dr
- 1334 Hatcher Loop Dr
- 1216 Franford Dr
- 1206 Franford Dr
- 1339 Hatcher Loop Dr
- 1337 Hatcher Loop Dr
- 1341 Hatcher Loop Dr
- 1218 Franford Dr
- 1204 Franford Dr
- 1204 Franford Dr
- 1204 Franford Dr Unit 22
- 1344 Hatcher Loop Dr
- 1335 Hatcher Loop Dr
- 1343 Hatcher Loop Dr
Your Personal Tour Guide
Ask me questions while you tour the home.