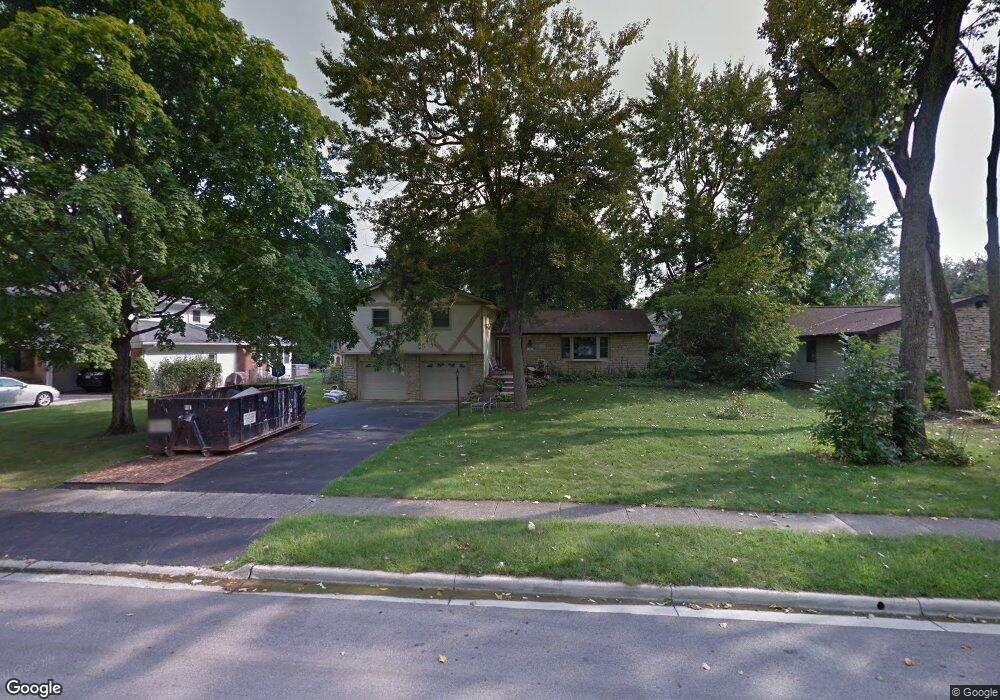
1339 N Castleton Rd Upper Arlington, OH
Estimated Value: $554,000 - $657,000
4
Beds
3
Baths
2,133
Sq Ft
$291/Sq Ft
Est. Value
About This Home
This home is located at 1339 N Castleton Rd, Upper Arlington, OH and is currently estimated at $620,375, approximately $290 per square foot. 1339 N Castleton Rd is a home located in Franklin County with nearby schools including Greensview Elementary School, Hastings Middle School, and Upper Arlington High School.
Ownership History
Date
Name
Owned For
Owner Type
Purchase Details
Closed on
May 21, 2009
Sold by
Plassman Thomas P and Plassman Joy H
Bought by
Coakley Janice A and Zartman Andrew H
Current Estimated Value
Home Financials for this Owner
Home Financials are based on the most recent Mortgage that was taken out on this home.
Original Mortgage
$269,637
Outstanding Balance
$167,408
Interest Rate
4.85%
Mortgage Type
FHA
Estimated Equity
$452,967
Purchase Details
Closed on
Mar 22, 2004
Sold by
Plassman Thomas P and Plassman Joy H
Bought by
Plassman Thomas P and Plassman Joy H
Purchase Details
Closed on
Jul 17, 1998
Sold by
Sale P Thomas and Sale Elizabeth N
Bought by
Plassman Thomas P and Plassman Joy H
Purchase Details
Closed on
Apr 1, 1994
Purchase Details
Closed on
Jun 28, 1990
Create a Home Valuation Report for This Property
The Home Valuation Report is an in-depth analysis detailing your home's value as well as a comparison with similar homes in the area
Home Values in the Area
Average Home Value in this Area
Purchase History
| Date | Buyer | Sale Price | Title Company |
|---|---|---|---|
| Coakley Janice A | $285,000 | Attorney | |
| Plassman Thomas P | -- | -- | |
| Plassman Thomas P | $187,000 | Chicago Title | |
| -- | $181,000 | -- | |
| -- | $170,000 | -- |
Source: Public Records
Mortgage History
| Date | Status | Borrower | Loan Amount |
|---|---|---|---|
| Open | Coakley Janice A | $269,637 |
Source: Public Records
Tax History
| Year | Tax Paid | Tax Assessment Tax Assessment Total Assessment is a certain percentage of the fair market value that is determined by local assessors to be the total taxable value of land and additions on the property. | Land | Improvement |
|---|---|---|---|---|
| 2025 | $10,743 | $185,570 | $88,270 | $97,300 |
| 2024 | $10,743 | $185,570 | $88,270 | $97,300 |
| 2023 | $10,610 | $185,570 | $88,270 | $97,300 |
| 2022 | $9,005 | $128,870 | $51,030 | $77,840 |
| 2021 | $8,121 | $128,870 | $51,030 | $77,840 |
| 2020 | $7,901 | $128,870 | $51,030 | $77,840 |
| 2019 | $7,692 | $110,710 | $51,030 | $59,680 |
| 2018 | $7,262 | $110,710 | $51,030 | $59,680 |
| 2017 | $7,366 | $110,710 | $51,030 | $59,680 |
| 2016 | $7,114 | $107,590 | $31,220 | $76,370 |
| 2015 | $6,872 | $104,020 | $31,220 | $72,800 |
| 2014 | $6,879 | $104,020 | $31,220 | $72,800 |
| 2013 | $3,286 | $94,570 | $28,385 | $66,185 |
Source: Public Records
Map
Nearby Homes
- 1415 Reymond Rd
- 4543 Ducrest Dr
- 1168 Airendel Ln Unit 1
- 1512 Lafayette Dr Unit B
- 1594 Lafayette Dr Unit 1594
- 4818 Winterset Dr Unit 820
- 1126 Merrimar Cir N Unit H
- 1126 Merrimar Cir N Unit M
- 4710 Charecote Ln Unit D
- 1466 Weybridge Rd
- 1046 Merrimar Cir N Unit B
- 1030 Galliton Ct Unit H
- 4944 Buck Thorn Ln
- 1415 Bradshire Dr Unit 1415-1417
- 1677 Francisco Rd
- 1904 Willoway Cir S Unit 1904
- 1865 Willoway Cir N Unit 1865
- 955 Amberly Place
- 5107 Delancey St
- 5118 Dalmeny Ct Unit 5118
- 1339 Castleton Rd N
- 1329 Castleton Rd N
- 1351 Castleton Rd N
- 1340 Norwell Dr
- 1350 Norwell Dr
- 1319 Castleton Rd N
- 1363 Castleton Rd N
- 1328 Norwell Dr
- 1360 Norwell Dr
- 1340 Castleton Rd N
- 1352 Castleton Rd N
- 1316 Norwell Dr
- 1320 Castleton Rd N
- 1307 Castleton Rd N
- 1375 Castleton Rd N
- 1370 Norwell Dr
- 1364 Castleton Rd N
- 4483 Reymond Ct
- 1304 Norwell Dr
- 1308 Castleton Rd N