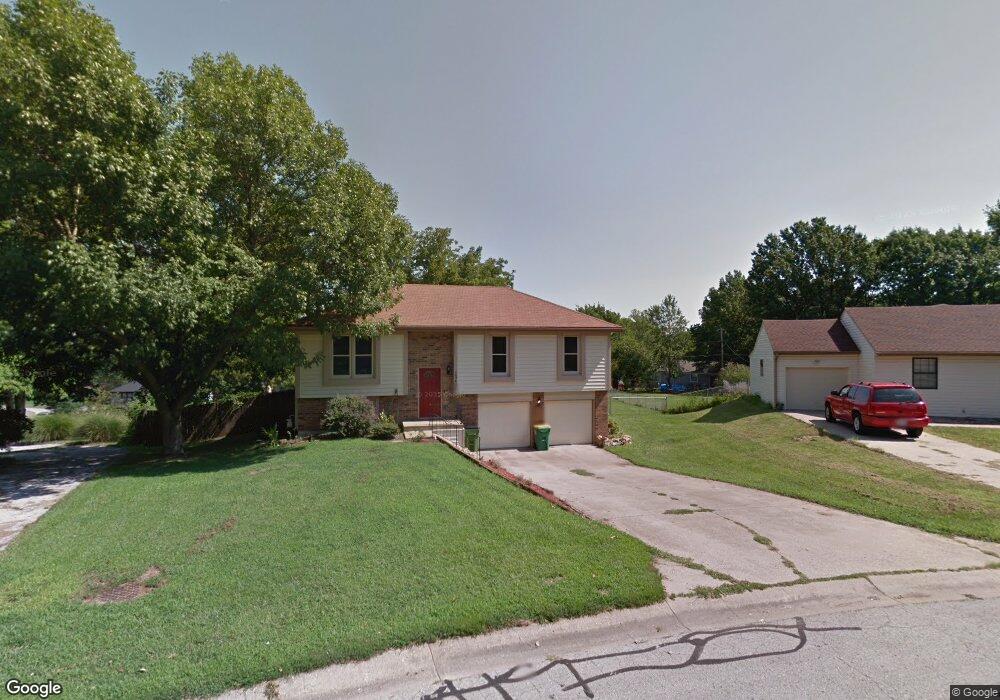
13400 W 60th St Shawnee, KS 66216
Estimated Value: $310,000 - $345,000
4
Beds
3
Baths
1,138
Sq Ft
$290/Sq Ft
Est. Value
About This Home
This home is located at 13400 W 60th St, Shawnee, KS 66216 and is currently estimated at $329,950, approximately $289 per square foot. 13400 W 60th St is a home located in Johnson County with nearby schools including Ray Marsh Elementary School, Trailridge Middle School, and Shawnee Mission Northwest High School.
Ownership History
Date
Name
Owned For
Owner Type
Purchase Details
Closed on
Oct 2, 2019
Sold by
Sanford Hans
Bought by
Sanford Beth
Current Estimated Value
Purchase Details
Closed on
Oct 25, 2011
Sold by
Sanford Hans D
Bought by
Sanford Hans and Sanford Beth
Home Financials for this Owner
Home Financials are based on the most recent Mortgage that was taken out on this home.
Original Mortgage
$148,470
Outstanding Balance
$14,539
Interest Rate
3.5%
Mortgage Type
FHA
Estimated Equity
$315,411
Purchase Details
Closed on
Jun 13, 2006
Sold by
Hawker Danille
Bought by
Sanford Hans D
Home Financials for this Owner
Home Financials are based on the most recent Mortgage that was taken out on this home.
Original Mortgage
$157,000
Interest Rate
6.56%
Mortgage Type
New Conventional
Purchase Details
Closed on
Jul 5, 2002
Sold by
Blackman Kelly M
Bought by
Hawker Danielle
Create a Home Valuation Report for This Property
The Home Valuation Report is an in-depth analysis detailing your home's value as well as a comparison with similar homes in the area
Home Values in the Area
Average Home Value in this Area
Purchase History
| Date | Buyer | Sale Price | Title Company |
|---|---|---|---|
| Sanford Beth | -- | None Available | |
| Sanford Hans | -- | None Available | |
| Sanford Hans D | -- | Chicago Titlte Ins Co | |
| Hawker Danielle | -- | -- |
Source: Public Records
Mortgage History
| Date | Status | Borrower | Loan Amount |
|---|---|---|---|
| Open | Sanford Hans | $148,470 | |
| Closed | Sanford Hans D | $157,000 |
Source: Public Records
Tax History Compared to Growth
Tax History
| Year | Tax Paid | Tax Assessment Tax Assessment Total Assessment is a certain percentage of the fair market value that is determined by local assessors to be the total taxable value of land and additions on the property. | Land | Improvement |
|---|---|---|---|---|
| 2024 | $3,506 | $33,292 | $7,753 | $25,539 |
| 2023 | $3,166 | $29,578 | $7,376 | $22,202 |
| 2022 | $3,063 | $28,508 | $6,703 | $21,805 |
| 2021 | $2,968 | $25,840 | $6,097 | $19,743 |
| 2020 | $2,753 | $23,644 | $5,545 | $18,099 |
| 2019 | $2,488 | $21,333 | $5,034 | $16,299 |
| 2018 | $2,458 | $20,999 | $5,034 | $15,965 |
| 2017 | $2,308 | $19,401 | $4,375 | $15,026 |
| 2016 | $2,185 | $18,124 | $4,375 | $13,749 |
| 2015 | $1,991 | $17,227 | $4,375 | $12,852 |
| 2013 | -- | $16,940 | $4,375 | $12,565 |
Source: Public Records
Map
Nearby Homes
- 5919 Pflumm Rd
- 4908 Noland Rd
- 5807 Noland Rd
- 6143 Park St
- 6145 Park St
- 12809 W 57th Terrace
- 5703 Cottonwood St
- 5713 Widmer Rd
- 5507 Noland Rd
- 5530 Rene St
- 5845 Caenen St
- 14204 W 63rd St
- 14214 W 63rd St
- 12508 W 56th St
- 13415 W 66th Terrace
- 5620 Monrovia St
- 5826 Oakview St
- 12116 W 63rd Terrace
- 6640 Pflumm Rd
- 5633 Oakview St
- 6001 Haskins St
- 13404 W 60th St
- 13309 W 59th Terrace
- 13305 W 59th Terrace
- 6000 Hauser Dr
- 13315 W 59th Terrace
- 13408 W 60th St
- 6008 Hauser Dr
- 6000 Haskins St
- 13301 W 59th Terrace
- 5921 Haskins St
- 13412 W 60th St
- 6009 Haskins St
- 5925 Haskins St
- 13409 W 60th St Unit 13409
- 13319 W 59th Terrace
- 6006 Haskins St
- 13407 W 60th St
- 6020 Hauser Dr
- 6013 Haskins St