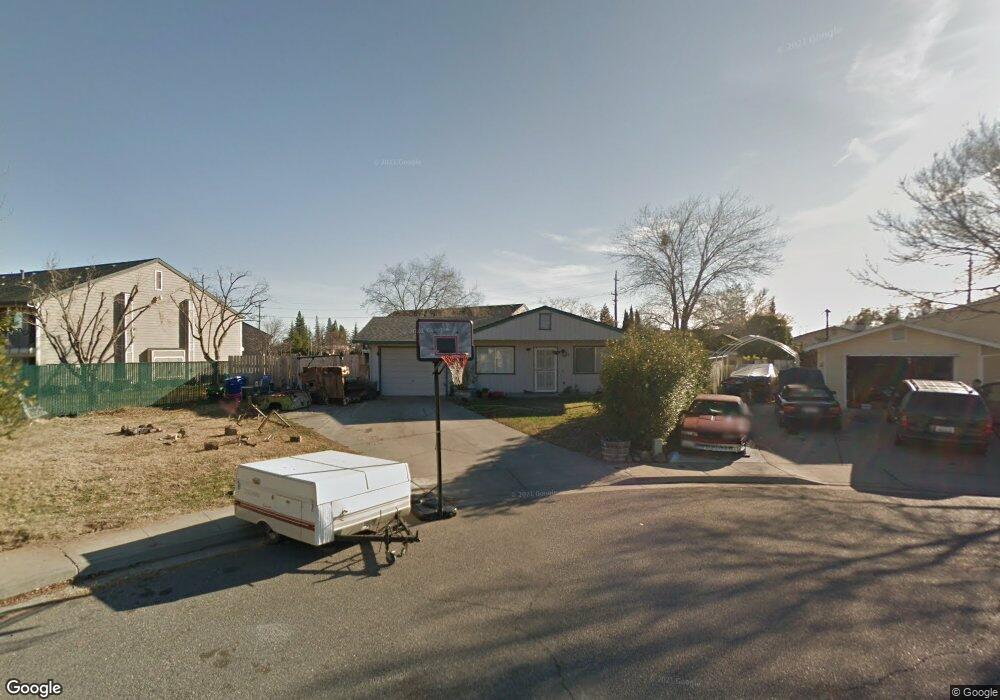
1346 Nelson Dr Red Bluff, CA 96080
Estimated Value: $250,327 - $300,000
3
Beds
2
Baths
1,080
Sq Ft
$245/Sq Ft
Est. Value
About This Home
This home is located at 1346 Nelson Dr, Red Bluff, CA 96080 and is currently estimated at $264,082, approximately $244 per square foot. 1346 Nelson Dr is a home located in Tehama County with nearby schools including William M. Metteer Elementary School, Vista Preparatory Academy, and Red Bluff High School.
Ownership History
Date
Name
Owned For
Owner Type
Purchase Details
Closed on
Nov 9, 2021
Sold by
Gildea Sheila Lane Foley and Gildea Sheila Lane
Bought by
Gildea Sheila Lane Foley and The Foley Gildea Family Trust
Current Estimated Value
Home Financials for this Owner
Home Financials are based on the most recent Mortgage that was taken out on this home.
Original Mortgage
$206,250
Interest Rate
3.01%
Mortgage Type
New Conventional
Purchase Details
Closed on
Aug 2, 2005
Sold by
Gildea Sheila Lane and Gildea Sheila Foley
Bought by
Gildea Sheila Lane
Home Financials for this Owner
Home Financials are based on the most recent Mortgage that was taken out on this home.
Original Mortgage
$133,250
Interest Rate
5.46%
Mortgage Type
New Conventional
Purchase Details
Closed on
Jan 4, 2001
Sold by
Lane Foley Sheila
Bought by
Lane Foley Sheila
Home Financials for this Owner
Home Financials are based on the most recent Mortgage that was taken out on this home.
Original Mortgage
$63,750
Interest Rate
7.65%
Create a Home Valuation Report for This Property
The Home Valuation Report is an in-depth analysis detailing your home's value as well as a comparison with similar homes in the area
Purchase History
| Date | Buyer | Sale Price | Title Company |
|---|---|---|---|
| Gildea Sheila Lane Foley | -- | Fidelity Natl Ttl Co Of Ca | |
| Gildea Sheila Lane | -- | Chicago Title Co | |
| Lane Foley Sheila | -- | Chicago Title Co |
Source: Public Records
Mortgage History
| Date | Status | Borrower | Loan Amount |
|---|---|---|---|
| Closed | Gildea Sheila Lane Foley | $206,250 | |
| Closed | Gildea Sheila Lane | $133,250 | |
| Closed | Lane Foley Sheila | $63,750 |
Source: Public Records
Tax History
| Year | Tax Paid | Tax Assessment Tax Assessment Total Assessment is a certain percentage of the fair market value that is determined by local assessors to be the total taxable value of land and additions on the property. | Land | Improvement |
|---|---|---|---|---|
| 2025 | $999 | $97,919 | $27,109 | $70,810 |
| 2023 | $983 | $94,118 | $26,057 | $68,061 |
| 2022 | $976 | $92,274 | $25,547 | $66,727 |
| 2021 | $937 | $90,466 | $25,047 | $65,419 |
| 2020 | $957 | $89,540 | $24,791 | $64,749 |
| 2019 | $963 | $87,785 | $24,305 | $63,480 |
| 2018 | $890 | $86,065 | $23,829 | $62,236 |
| 2017 | $898 | $84,378 | $23,362 | $61,016 |
| 2016 | $839 | $82,724 | $22,904 | $59,820 |
| 2015 | -- | $81,482 | $22,560 | $58,922 |
| 2014 | $815 | $79,887 | $22,119 | $57,768 |
Source: Public Records
Map
Nearby Homes
- 10.94 S Jackson St
- 1212 S Jackson St
- 10.04 Vista Way
- 56.19 Vista Way
- 1210 Wetter Way
- 810 Vista Way
- 1235 Britt Ln
- 131 Brookridge Dr Unit 1
- 1560 Carl Ct
- 1160 Orange St
- 425 S Jackson St
- 406 S Jackson St
- 845 Olive St
- 1455 Acacia St
- 1480 Leonard Ln
- 821 Locust St
- 224 S Jackson St
- 660 Villa Dr
- 1307 Deborah Dr
- 1270 Aloha St
- 1342 Nelson Dr
- 1338 Nelson Dr
- 930 Kimball Rd
- 1347 Nelson Dr
- 940 Kimball Rd
- 1343 Nelson Dr
- 1321 Nelson Dr
- 1334 Nelson Dr
- 1010 Kimball Rd
- 1317 Nelson Dr
- 1339 Nelson Dr
- 1020 Kimball Rd
- 1330 Nelson Dr
- 1313 Nelson Dr
- 1326 Nelson Dr
- 1322 Nelson Dr
- 1030 Kimball Rd
- 1318 Nelson Dr
- 935 Hasvold Dr
- 925 Hasvold Dr
Your Personal Tour Guide
Ask me questions while you tour the home.