1348 Euclid Ave Berkeley, CA 94708
Berkeley Hills NeighborhoodEstimated Value: $1,272,000 - $2,113,621
4
Beds
2
Baths
2,600
Sq Ft
$675/Sq Ft
Est. Value
About This Home
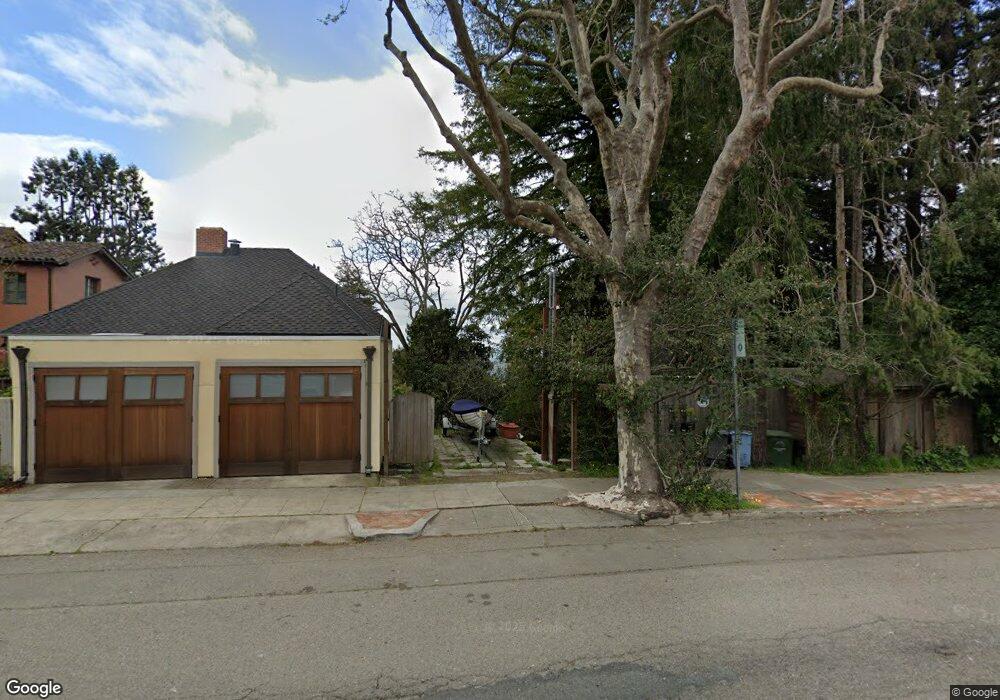
This home is located at 1348 Euclid Ave, Berkeley, CA 94708 and is currently estimated at $1,754,905, approximately $674 per square foot. 1348 Euclid Ave is a home located in Alameda County with nearby schools including Berkeley Arts Magnet at Whittier School, Cragmont Elementary School, and Washington Elementary School.
Ownership History
Date
Name
Owned For
Owner Type
Purchase Details
Closed on
Aug 13, 2019
Sold by
Leiman Oren S
Bought by
Leiman Oren S and Oren S Leiman Living Trust
Current Estimated Value
Purchase Details
Closed on
Oct 17, 2001
Sold by
Leiman Marguerite
Bought by
Leiman Oren
Home Financials for this Owner
Home Financials are based on the most recent Mortgage that was taken out on this home.
Original Mortgage
$483,000
Outstanding Balance
$188,787
Interest Rate
6.87%
Estimated Equity
$1,566,118
Purchase Details
Closed on
Jul 7, 1997
Sold by
Lofting Irene A
Bought by
Leiman Oren and Leiman Marguerite
Home Financials for this Owner
Home Financials are based on the most recent Mortgage that was taken out on this home.
Original Mortgage
$284,000
Interest Rate
7.93%
Mortgage Type
Purchase Money Mortgage
Create a Home Valuation Report for This Property
The Home Valuation Report is an in-depth analysis detailing your home's value as well as a comparison with similar homes in the area
Home Values in the Area
Average Home Value in this Area
Purchase History
| Date | Buyer | Sale Price | Title Company |
|---|---|---|---|
| Leiman Oren S | -- | None Available | |
| Leiman Oren | -- | Placer Title Company | |
| Leiman Oren | $355,000 | Placer Title Company |
Source: Public Records
Mortgage History
| Date | Status | Borrower | Loan Amount |
|---|---|---|---|
| Open | Leiman Oren | $483,000 | |
| Closed | Leiman Oren | $284,000 |
Source: Public Records
Tax History
| Year | Tax Paid | Tax Assessment Tax Assessment Total Assessment is a certain percentage of the fair market value that is determined by local assessors to be the total taxable value of land and additions on the property. | Land | Improvement |
|---|---|---|---|---|
| 2025 | $11,793 | $559,809 | $170,042 | $396,767 |
| 2024 | $11,793 | $548,698 | $166,709 | $388,989 |
| 2023 | $11,470 | $544,803 | $163,440 | $381,363 |
| 2022 | $11,366 | $527,122 | $160,236 | $373,886 |
| 2021 | $11,353 | $516,652 | $157,095 | $366,557 |
| 2020 | $10,676 | $518,286 | $155,485 | $362,801 |
| 2019 | $10,159 | $508,128 | $152,438 | $355,690 |
| 2018 | $9,932 | $498,168 | $149,450 | $348,718 |
| 2017 | $9,563 | $488,402 | $146,520 | $341,882 |
| 2016 | $9,158 | $478,826 | $143,647 | $335,179 |
| 2015 | $9,007 | $471,637 | $141,490 | $330,147 |
| 2014 | $8,927 | $462,399 | $138,719 | $323,680 |
Source: Public Records
Map
Nearby Homes
- 2501 Rose Walk
- 1400 Le Roy Ave
- 1471 Scenic Ave
- 2315 Eunice St
- 2686 Shasta Rd
- 2893 Buena Vista Way
- 1412 Oxford St
- 1622 Scenic Ave
- 1519 Oxford St Unit E
- 2121 Eunice St
- 1444 Walnut St
- 2600 Hilgard Ave
- 2477 Virginia St
- 1179 Keith Ave
- 2365 Virginia St Unit 2
- 2340 Virginia St
- 2451 Le Conte Ave
- 1698 La Loma Ave Unit 1698
- 1165 Cragmont Ave
- 2634 Virginia St Unit 13
- 1360 Euclid Ave
- 1370 Euclid Ave
- 1387 Scenic Ave
- 1395 Scenic Ave
- 1322 Euclid Ave
- 1355 Scenic Ave
- 1382 Euclid Ave
- 1351 Scenic Ave
- 1314 Euclid Ave
- 1305 Bay View Place
- 1306 Euclid Ave
- 1406 Hawthorne Terrace Unit A
- 1401 Scenic Ave
- 1345 Bay View Place
- 1400 Euclid Ave
- 1408 Hawthorne Terrace
- 1307 Bay View Place
- 1404 Hawthorne Terrace
- 1403 Scenic Ave
- 1350 Scenic Ave
Your Personal Tour Guide
Ask me questions while you tour the home.