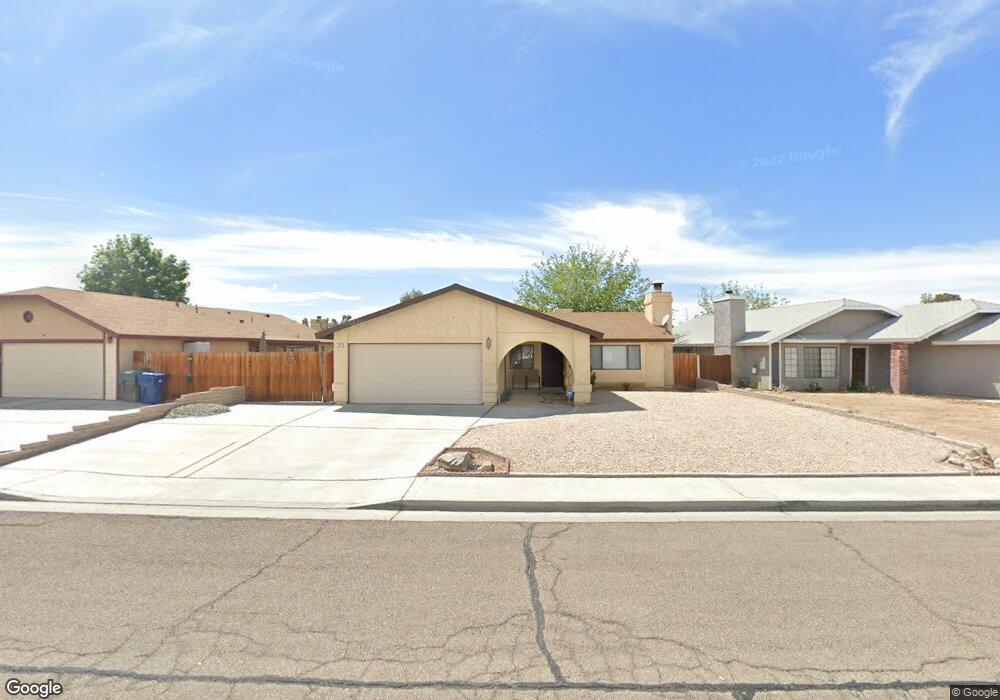
135 Chambers St Ridgecrest, CA 93555
Estimated Value: $205,000 - $258,000
3
Beds
2
Baths
1,188
Sq Ft
$195/Sq Ft
Est. Value
About This Home
This home is located at 135 Chambers St, Ridgecrest, CA 93555 and is currently estimated at $231,111, approximately $194 per square foot. 135 Chambers St is a home located in Kern County with nearby schools including Pierce Elementary School, Murray Middle School, and Burroughs High School.
Ownership History
Date
Name
Owned For
Owner Type
Purchase Details
Closed on
Dec 19, 2018
Sold by
Waterman Brian J and Waterman Mung T
Bought by
Coons Clint and Chambers Cove Trust
Current Estimated Value
Purchase Details
Closed on
Sep 21, 2018
Sold by
Zaccheus Foundation
Bought by
Waterman Brian J
Purchase Details
Closed on
Jan 30, 2007
Sold by
Waterman Brian J and Waterman Mung T
Bought by
Cimarron Management Llc and Zaccheus Foundation Trust
Purchase Details
Closed on
Nov 29, 2000
Sold by
Stangeland Netty F
Bought by
Stangeland Stephen
Purchase Details
Closed on
Jul 31, 2000
Sold by
Corlett Carol J
Bought by
Waterman Brian J and Waterman Mung T
Purchase Details
Closed on
May 3, 2000
Sold by
Corlett Leroy H
Bought by
Corlett Carol J
Purchase Details
Closed on
Jan 20, 1997
Sold by
Hobbs James A and Hobbs Mildred M
Bought by
Hobbs James A and Hobbs Mildred M
Create a Home Valuation Report for This Property
The Home Valuation Report is an in-depth analysis detailing your home's value as well as a comparison with similar homes in the area
Home Values in the Area
Average Home Value in this Area
Purchase History
| Date | Buyer | Sale Price | Title Company |
|---|---|---|---|
| Coons Clint | -- | None Available | |
| Waterman Brian J | -- | None Available | |
| Cimarron Management Llc | -- | None Available | |
| Stangeland Stephen | -- | -- | |
| Waterman Brian J | $60,000 | First American Title Co | |
| Corlett Carol J | -- | First American Title Co | |
| Hobbs James A | -- | -- |
Source: Public Records
Tax History Compared to Growth
Tax History
| Year | Tax Paid | Tax Assessment Tax Assessment Total Assessment is a certain percentage of the fair market value that is determined by local assessors to be the total taxable value of land and additions on the property. | Land | Improvement |
|---|---|---|---|---|
| 2025 | $558 | $90,383 | $9,027 | $81,356 |
| 2024 | $549 | $88,611 | $8,850 | $79,761 |
| 2023 | $549 | $86,875 | $8,677 | $78,198 |
| 2022 | $538 | $85,172 | $8,507 | $76,665 |
| 2021 | $1,399 | $83,503 | $8,341 | $75,162 |
| 2020 | $1,361 | $82,648 | $8,256 | $74,392 |
| 2019 | $1,343 | $82,648 | $8,256 | $74,392 |
| 2018 | $1,324 | $79,441 | $7,937 | $71,504 |
| 2017 | $1,320 | $77,884 | $7,782 | $70,102 |
| 2016 | $1,273 | $76,358 | $7,630 | $68,728 |
| 2015 | $1,252 | $75,212 | $7,516 | $67,696 |
| 2014 | $1,128 | $73,739 | $7,369 | $66,370 |
Source: Public Records
Map
Nearby Homes
- 142 Chambers St Unit K
- 124 Jacquelyn Ct
- 1 E Ridgecrest Blvd
- 625 Cottonwood Dr
- 134 N American St
- 0 S Gateway Blvd
- 632-A Commercial
- 729 N Sunland Dr Unit H
- 2005 S American St
- 112 Valley St
- 525 E Ridgecrest Blvd Unit 11
- 217 S American St
- 645 E Church Ave
- 504 Commercial Ave Unit A
- 228 S Greenlawn St
- 0 E Ridgecrest Blvd
- 205 Rancho St
- 314 Reese St
- 1006 E Church Ave
- 320 S Gateway Blvd
- 131 Chambers St Unit K
- 139 Chambers St Unit K
- 130 N Broadway St Unit D
- 127 Chambers St Unit K
- 126 N Broadway St
- 143 Chambers St
- 134 N Broadway St Unit C
- 138 Chambers St
- 134 Chambers St Unit K
- 123 Chambers St Unit K
- 122 N Broadway St
- 130 Chambers St
- 146 Chambers St
- 126 Chambers St
- 119 Chambers St
- 118 N Broadway St
- 140 N Gwen Dr
- 201 Chambers St
- 200 N Gwen Dr
- 200 N Broadway St