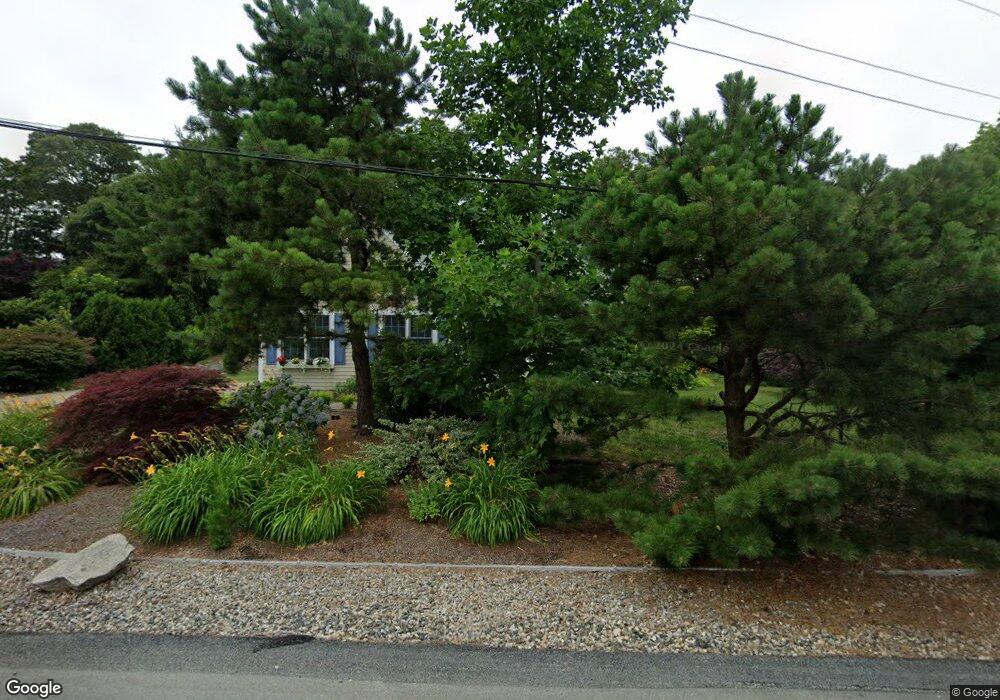
135 Elgin Rd Pocasset, MA 02559
Pocasset NeighborhoodEstimated Value: $762,000 - $1,032,000
3
Beds
2
Baths
1,834
Sq Ft
$478/Sq Ft
Est. Value
About This Home
This home is located at 135 Elgin Rd, Pocasset, MA 02559 and is currently estimated at $875,785, approximately $477 per square foot. 135 Elgin Rd is a home located in Barnstable County with nearby schools including Bourne High School, Cadence Academy Preschool - Bourne, and Heritage Christian Academy.
Ownership History
Date
Name
Owned For
Owner Type
Purchase Details
Closed on
Oct 16, 2025
Sold by
Stedman Florence K
Bought by
135 Elgin Road Rt and Stedman
Current Estimated Value
Purchase Details
Closed on
Aug 16, 2004
Sold by
Quail Hollow Rt and Lapierre
Bought by
Stedman Florence K
Purchase Details
Closed on
May 5, 2004
Sold by
White David A and White Susan E
Bought by
Quail Hollow Rt and Lapierre
Purchase Details
Closed on
Apr 18, 2001
Sold by
Morlock Ft and Morlock
Bought by
White David A and White Susan E
Create a Home Valuation Report for This Property
The Home Valuation Report is an in-depth analysis detailing your home's value as well as a comparison with similar homes in the area
Home Values in the Area
Average Home Value in this Area
Purchase History
| Date | Buyer | Sale Price | Title Company |
|---|---|---|---|
| 135 Elgin Road Rt | -- | -- | |
| Stedman Florence K | $345,000 | -- | |
| Stedman Florence K | $345,000 | -- | |
| Stedman Florence K | $345,000 | -- | |
| Quail Hollow Rt | $270,000 | -- | |
| Quail Hollow Rt | $270,000 | -- | |
| Quail Hollow Rt | $270,000 | -- | |
| White David A | $153,250 | -- | |
| White David A | $153,250 | -- |
Source: Public Records
Mortgage History
| Date | Status | Borrower | Loan Amount |
|---|---|---|---|
| Previous Owner | White David A | $800,000 |
Source: Public Records
Tax History
| Year | Tax Paid | Tax Assessment Tax Assessment Total Assessment is a certain percentage of the fair market value that is determined by local assessors to be the total taxable value of land and additions on the property. | Land | Improvement |
|---|---|---|---|---|
| 2025 | $6,309 | $807,800 | $423,800 | $384,000 |
| 2024 | $6,203 | $773,500 | $403,600 | $369,900 |
| 2023 | $5,491 | $623,300 | $292,200 | $331,100 |
| 2022 | $5,510 | $546,100 | $280,200 | $265,900 |
| 2021 | $5,383 | $499,800 | $255,000 | $244,800 |
| 2020 | $5,254 | $489,200 | $252,500 | $236,700 |
| 2019 | $5,028 | $478,400 | $252,500 | $225,900 |
| 2018 | $4,710 | $446,900 | $240,600 | $206,300 |
| 2017 | $4,559 | $442,600 | $238,300 | $204,300 |
| 2016 | $4,442 | $437,200 | $238,300 | $198,900 |
| 2015 | $4,403 | $437,200 | $238,300 | $198,900 |
Source: Public Records
Map
Nearby Homes
Your Personal Tour Guide
Ask me questions while you tour the home.