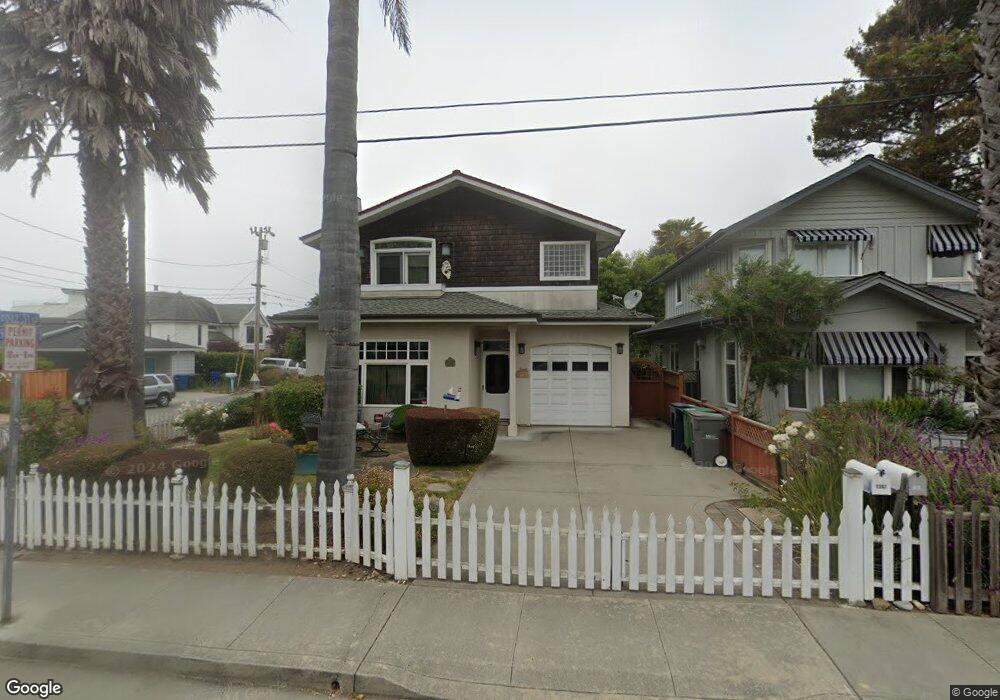
1351 49th Ave Capitola, CA 95010
Estimated Value: $1,970,000 - $2,223,000
3
Beds
3
Baths
1,758
Sq Ft
$1,187/Sq Ft
Est. Value
About This Home
This home is located at 1351 49th Ave, Capitola, CA 95010 and is currently estimated at $2,087,387, approximately $1,187 per square foot. 1351 49th Ave is a home located in Santa Cruz County with nearby schools including Soquel Elementary School, New Brighton Middle School, and Mission Hill Middle School.
Ownership History
Date
Name
Owned For
Owner Type
Purchase Details
Closed on
Jun 19, 2024
Sold by
Butler Family Bypass Trust and Schanen Shari L
Bought by
Schanen Shari L
Current Estimated Value
Purchase Details
Closed on
Oct 18, 2019
Sold by
Butler Norman D
Bought by
Butler Norman D and Butler Family Bypass Trust
Purchase Details
Closed on
Sep 11, 2006
Sold by
Thermond Jeffery L and Thermond Catherine A
Bought by
Butler Norman D and Butler Judy Ann
Home Financials for this Owner
Home Financials are based on the most recent Mortgage that was taken out on this home.
Original Mortgage
$956,200
Interest Rate
6.56%
Mortgage Type
Purchase Money Mortgage
Purchase Details
Closed on
Feb 2, 2006
Sold by
Thermond Jeffery L and Thermond Catherine A
Bought by
Thermond Jeffery L and Thermond Catherine A
Purchase Details
Closed on
Jan 27, 2000
Sold by
Bradley/Delmonte Llc
Bought by
Thermond Jeffery L and Thermond Catherine A
Create a Home Valuation Report for This Property
The Home Valuation Report is an in-depth analysis detailing your home's value as well as a comparison with similar homes in the area
Home Values in the Area
Average Home Value in this Area
Purchase History
We collect this data history from publicly available records. To have your information removed, we recommend requesting removal directly through your county’s website.
| Date | Buyer | Sale Price | Title Company |
|---|---|---|---|
| Schanen Shari L | -- | None Listed On Document | |
| Butler Norman D | -- | None Available | |
| Butler Norman D | $1,275,000 | First American Title Company | |
| Thermond Jeffery L | -- | None Available | |
| Thermond Jeffery L | -- | None Available | |
| Thermond Jeffery L | $950,000 | Santa Cruz Title Company |
Source: Public Records
Mortgage History
We collect this data history from publicly available records. To have your information removed, we recommend requesting removal directly through your county’s website.
| Date | Status | Borrower | Loan Amount |
|---|---|---|---|
| Previous Owner | Butler Norman D | $956,200 |
Source: Public Records
Tax History
| Year | Tax Paid | Tax Assessment Tax Assessment Total Assessment is a certain percentage of the fair market value that is determined by local assessors to be the total taxable value of land and additions on the property. | Land | Improvement |
|---|---|---|---|---|
| 2025 | $19,445 | $1,708,234 | $1,239,307 | $468,927 |
| 2023 | $19,055 | $1,641,901 | $1,191,183 | $450,718 |
| 2022 | $18,870 | $1,609,707 | $1,167,827 | $441,880 |
| 2021 | $18,448 | $1,578,144 | $1,144,928 | $433,216 |
| 2020 | $16,587 | $1,409,566 | $1,022,634 | $386,932 |
| 2019 | $16,741 | $1,431,582 | $1,038,607 | $392,975 |
| 2018 | $16,909 | $1,441,905 | $1,046,095 | $395,810 |
| 2017 | $16,090 | $1,360,288 | $986,882 | $373,406 |
| 2016 | $14,390 | $1,259,526 | $913,779 | $345,747 |
| 2015 | $13,553 | $1,188,232 | $862,054 | $326,178 |
| 2014 | $12,291 | $1,070,479 | $776,624 | $293,855 |
Source: Public Records
Map
Nearby Homes
- 4755 Topaz St
- 750 47th Ave Unit 56
- 750 47th Ave Unit 69
- 4630 Jewel St
- 4840 Cliff Dr
- 4705 Garnet St
- 1425 45th Ave Unit 1
- 4455 Jade St Unit 4
- 1500 Wharf Rd Unit 12
- 1500 Wharf Rd Unit 22
- 1500 Wharf Rd
- 4475 Diamond St Unit 3
- 4160 Jade St Unit 99
- 4160 Jade St Unit 90
- 431 Capitola Ave
- 533 Riverview Dr
- 1066 41st Ave Unit A303
- 1066 41st Ave Unit A207
- 1925 46th Ave Unit 127
- 1925 46th Ave Unit 71
Your Personal Tour Guide
Ask me questions while you tour the home.