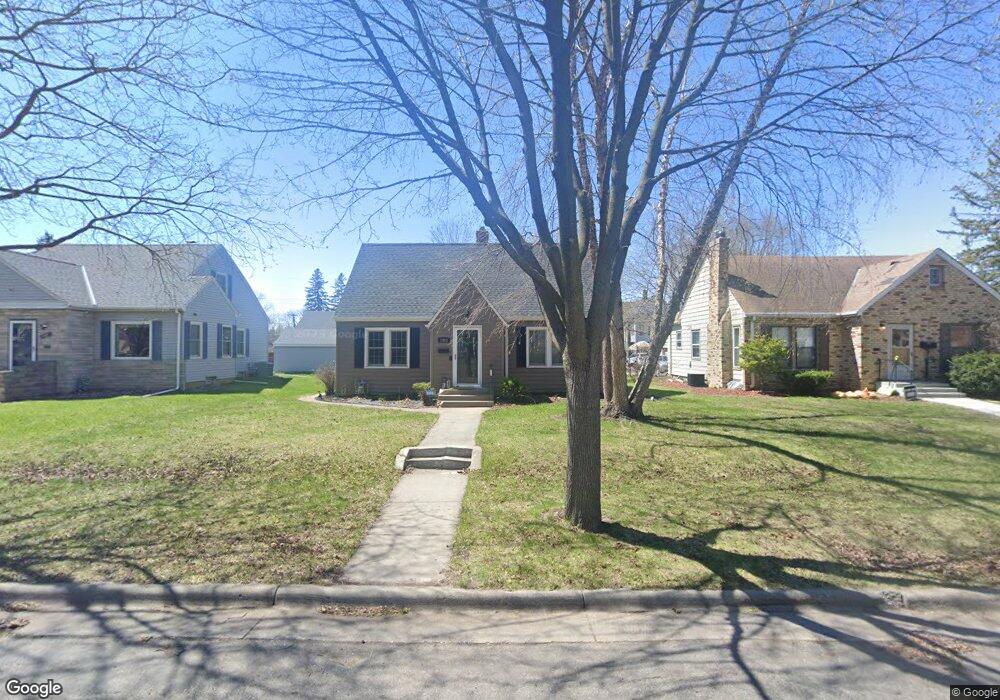
1351 Danforth St Saint Paul, MN 55117
North End NeighborhoodEstimated Value: $292,000 - $371,000
3
Beds
1
Bath
966
Sq Ft
$331/Sq Ft
Est. Value
About This Home
This home is located at 1351 Danforth St, Saint Paul, MN 55117 and is currently estimated at $319,267, approximately $330 per square foot. 1351 Danforth St is a home located in Ramsey County with nearby schools including Como Park Elementary School, Murray Middle School, and Como Park Senior High School.
Ownership History
Date
Name
Owned For
Owner Type
Purchase Details
Closed on
Apr 13, 2018
Sold by
Lemke Samuel L and Lemke Ashley P
Bought by
Williams Jeremy
Current Estimated Value
Home Financials for this Owner
Home Financials are based on the most recent Mortgage that was taken out on this home.
Original Mortgage
$229,761
Outstanding Balance
$197,682
Interest Rate
4.46%
Mortgage Type
FHA
Estimated Equity
$121,585
Purchase Details
Closed on
Jun 19, 2015
Sold by
Barnidge Michael P and Barnidge Lisa K
Bought by
Gainor Ashley P
Home Financials for this Owner
Home Financials are based on the most recent Mortgage that was taken out on this home.
Original Mortgage
$193,903
Interest Rate
3.82%
Mortgage Type
New Conventional
Purchase Details
Closed on
Aug 3, 2000
Sold by
Sneddon Christopher S and Reimer Connie L
Bought by
Osborne Jeffrey P and Osborne Maria L
Create a Home Valuation Report for This Property
The Home Valuation Report is an in-depth analysis detailing your home's value as well as a comparison with similar homes in the area
Home Values in the Area
Average Home Value in this Area
Purchase History
| Date | Buyer | Sale Price | Title Company |
|---|---|---|---|
| Williams Jeremy | $234,000 | Clear Title Llc | |
| Gainor Ashley P | $205,957 | Burnet Title | |
| Osborne Jeffrey P | $126,500 | -- |
Source: Public Records
Mortgage History
| Date | Status | Borrower | Loan Amount |
|---|---|---|---|
| Open | Williams Jeremy | $229,761 | |
| Previous Owner | Gainor Ashley P | $193,903 |
Source: Public Records
Tax History
| Year | Tax Paid | Tax Assessment Tax Assessment Total Assessment is a certain percentage of the fair market value that is determined by local assessors to be the total taxable value of land and additions on the property. | Land | Improvement |
|---|---|---|---|---|
| 2025 | $4,646 | $313,300 | $50,000 | $263,300 |
| 2023 | $4,646 | $306,100 | $50,000 | $256,100 |
| 2022 | $3,880 | $299,000 | $50,000 | $249,000 |
| 2021 | $3,588 | $250,300 | $50,000 | $200,300 |
| 2020 | $3,500 | $231,400 | $34,300 | $197,100 |
| 2019 | $3,222 | $221,300 | $34,300 | $187,000 |
| 2018 | $2,968 | $203,300 | $34,300 | $169,000 |
| 2017 | $2,556 | $194,800 | $34,300 | $160,500 |
| 2016 | $2,048 | $0 | $0 | $0 |
| 2015 | $2,348 | $138,500 | $34,300 | $104,200 |
| 2014 | $2,526 | $0 | $0 | $0 |
Source: Public Records
Map
Nearby Homes
- 585 Cottage Ave W
- 1406 Schletti St
- 1300 Schletti St
- 1187 Dale St N
- 1585 Cohansey St Unit 104
- 1104 MacKubin St
- 1070 Dale St N
- 1547 Virginia St
- 1248 Farrington St
- 1049 Kent St
- 1048 Dale St N
- 1489 Matilda St
- 698 Larpenteur Ave W
- 307 Maryland Ave W
- 1151 Farrington St
- 1120 Virginia St
- 869 Iowa Ave W
- 1215 Galtier St
- 1041 Western Ave N
- 1365 N Woodbridge St
- 1357 Danforth St
- 1347 Danforth St
- 1357 Danforth St N
- 1361 Danforth St
- 1343 Danforth St
- 1354 Dale St N
- 1348 Dale St N
- 1367 Danforth St
- 1367 1367 Danforth-Street-
- 1360 Dale St N
- 1342 1342 Dale St N
- 1350 Danforth St
- 1354 Danforth St
- 1344 Danforth St
- 1358 Danforth St
- 1373 Danforth St
- 1373 1373 Danforth-Street-
- 1338 Dale St N
- 1362 Danforth St
- 599 Wheelock Pkwy W
Your Personal Tour Guide
Ask me questions while you tour the home.