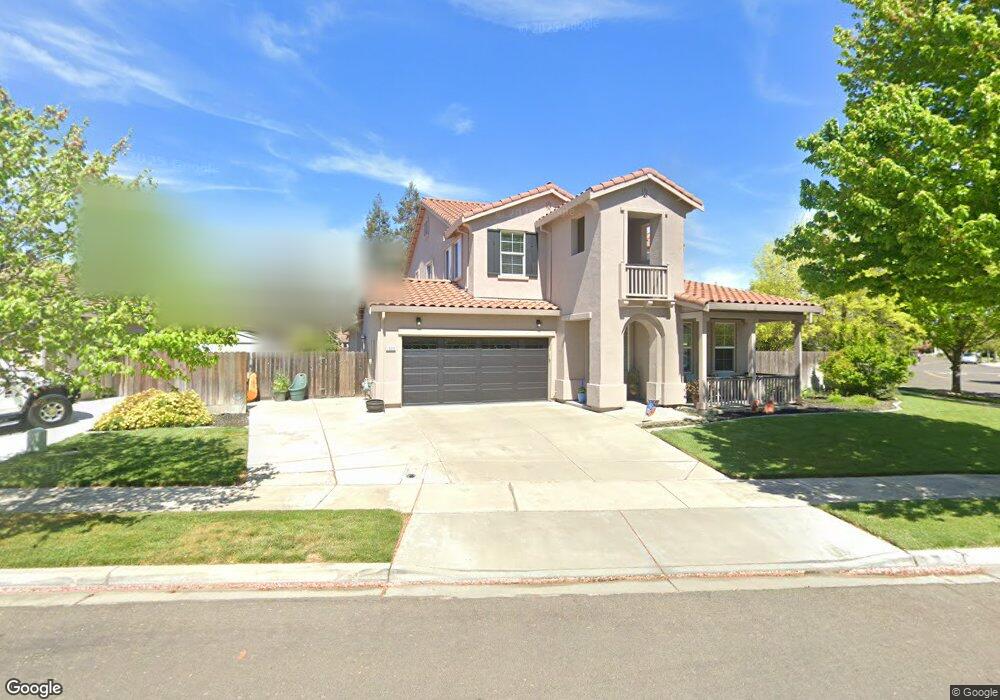
1355 Macie Way Turlock, CA 95382
Estimated Value: $674,000 - $688,591
5
Beds
3
Baths
2,970
Sq Ft
$229/Sq Ft
Est. Value
About This Home
This home is located at 1355 Macie Way, Turlock, CA 95382 and is currently estimated at $681,398, approximately $229 per square foot. 1355 Macie Way is a home located in Stanislaus County with nearby schools including Dennis G. Earl Elementary School, Marvin A. Dutcher Middle School, and Turlock Junior High School.
Ownership History
Date
Name
Owned For
Owner Type
Purchase Details
Closed on
Oct 5, 2022
Sold by
Gaffney Rick L
Bought by
Rick L Gaffney And Ruth E Bonander 2022 Revoc and Gaffney
Current Estimated Value
Purchase Details
Closed on
Feb 11, 2011
Sold by
Orchard Terrace Estates Llc
Bought by
Gaffney Rick
Home Financials for this Owner
Home Financials are based on the most recent Mortgage that was taken out on this home.
Original Mortgage
$239,200
Interest Rate
4.74%
Mortgage Type
New Conventional
Purchase Details
Closed on
Nov 8, 2010
Sold by
Yslava Alex Jose and Yslava Maria Lourdes
Bought by
Orchard Terrace Estates Llc
Purchase Details
Closed on
Aug 30, 2006
Sold by
Morrison Homes Inc
Bought by
Yslava Alex Jose and Yslava Maria Lourdes
Home Financials for this Owner
Home Financials are based on the most recent Mortgage that was taken out on this home.
Original Mortgage
$408,800
Interest Rate
5.75%
Mortgage Type
Purchase Money Mortgage
Create a Home Valuation Report for This Property
The Home Valuation Report is an in-depth analysis detailing your home's value as well as a comparison with similar homes in the area
Purchase History
| Date | Buyer | Sale Price | Title Company |
|---|---|---|---|
| Rick L Gaffney And Ruth E Bonander 2022 Revoc | -- | None Listed On Document | |
| Gaffney Rick | -- | First American Title Company | |
| Orchard Terrace Estates Llc | $242,251 | Accommodation | |
| Yslava Alex Jose | $511,500 | First American Title Co |
Source: Public Records
Mortgage History
| Date | Status | Borrower | Loan Amount |
|---|---|---|---|
| Previous Owner | Gaffney Rick | $239,200 | |
| Previous Owner | Yslava Alex Jose | $408,800 |
Source: Public Records
Tax History
| Year | Tax Paid | Tax Assessment Tax Assessment Total Assessment is a certain percentage of the fair market value that is determined by local assessors to be the total taxable value of land and additions on the property. | Land | Improvement |
|---|---|---|---|---|
| 2025 | $5,208 | $383,062 | $115,302 | $267,760 |
| 2024 | $5,498 | $375,552 | $113,042 | $262,510 |
| 2023 | $5,471 | $368,189 | $110,826 | $257,363 |
| 2022 | $5,393 | $360,970 | $108,653 | $252,317 |
| 2021 | $5,218 | $353,893 | $106,523 | $247,370 |
| 2020 | $5,162 | $350,265 | $105,431 | $244,834 |
| 2019 | $5,043 | $343,398 | $103,364 | $240,034 |
| 2018 | $5,023 | $336,666 | $101,338 | $235,328 |
| 2017 | $4,868 | $330,065 | $99,351 | $230,714 |
| 2016 | $4,609 | $323,594 | $97,403 | $226,191 |
| 2015 | $4,550 | $318,734 | $95,940 | $222,794 |
| 2014 | $4,490 | $312,491 | $94,061 | $218,430 |
Source: Public Records
Map
Nearby Homes
- 4245 Silver Lupine Dr
- 1383 Kinship Dr
- 4227 Ivory Ln
- 4184 Ivory Ln
- 4102 Windrose Dr
- 3815 N Berkeley Ave
- 4638 Cherry Blossom Ln
- 3703 Brookstone Dr
- 785 Fullerton Dr
- 834 Cedar Ridge Dr
- 790 Hillsdale Dr
- 2061 Zane Way
- 3360 Stanley Ave
- 4500 Fosberg Rd
- 3221 Amethyst Way
- 3361 Vanderbilt Ave
- 3161 Bridgeport Ct
- 225 Fullerton Dr
- 3140 Kellogg Ave
- 1663 Alex Way
- 4153 Enclave Dr
- 1345 Macie Way
- 4049 Enclave Dr
- 1340 E Springer Dr
- 4149 Enclave Dr
- 4154 Enclave Dr
- 1320 E Springer Dr
- 4045 Enclave Dr
- 4158 Enclave Dr
- 4145 Enclave Dr
- 4150 Enclave Dr
- 1334 Macie Way
- 1300 E Springer Dr
- 4041 Enclave Dr
- 1420 E Springer Dr
- 4146 Enclave Dr
- 4046 Enclave Dr
- 4141 Enclave Dr
- 1280 E Springer Dr
Your Personal Tour Guide
Ask me questions while you tour the home.