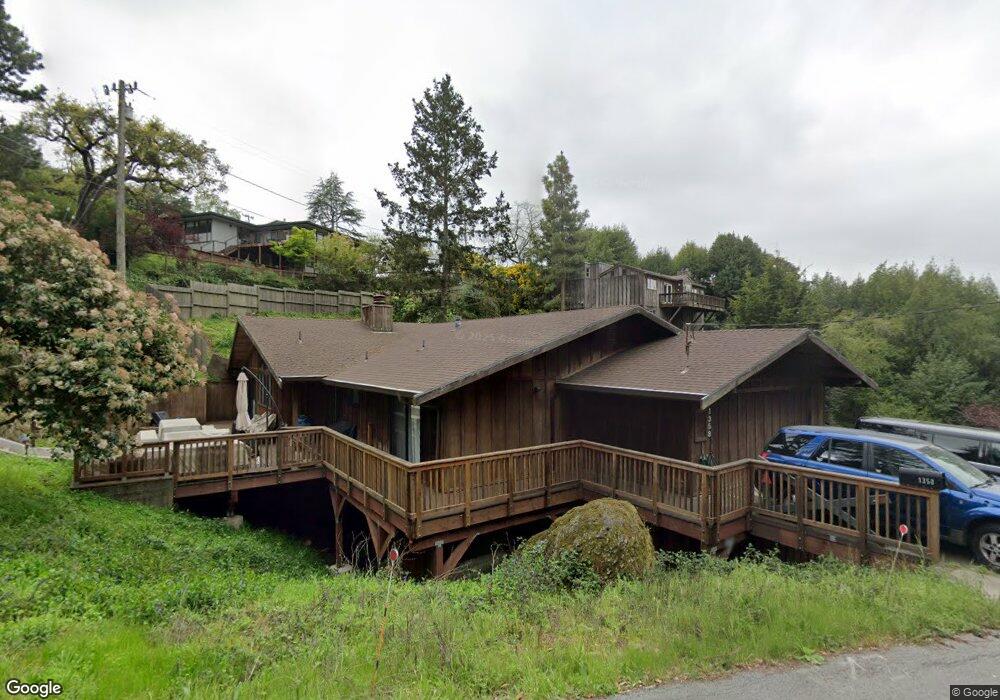
1358 Campus Dr Berkeley, CA 94708
Berkeley Hills NeighborhoodEstimated Value: $1,517,000 - $1,830,000
3
Beds
2
Baths
2,563
Sq Ft
$670/Sq Ft
Est. Value
About This Home
This home is located at 1358 Campus Dr, Berkeley, CA 94708 and is currently estimated at $1,717,835, approximately $670 per square foot. 1358 Campus Dr is a home located in Alameda County with nearby schools including Cragmont Elementary School, Berkeley Arts Magnet at Whittier School, and Washington Elementary School.
Ownership History
Date
Name
Owned For
Owner Type
Purchase Details
Closed on
Oct 22, 2009
Sold by
Stone Christopher P and Stone Owen E
Bought by
Stone Christopher P and Stone Owen E
Current Estimated Value
Home Financials for this Owner
Home Financials are based on the most recent Mortgage that was taken out on this home.
Original Mortgage
$575,000
Outstanding Balance
$373,930
Interest Rate
5%
Mortgage Type
New Conventional
Estimated Equity
$1,343,905
Purchase Details
Closed on
Apr 16, 2004
Sold by
Rosenberg Mark and Rosenberg Deanna H
Bought by
Stone Christopher P and Stone Karleen S
Home Financials for this Owner
Home Financials are based on the most recent Mortgage that was taken out on this home.
Original Mortgage
$550,000
Interest Rate
5.39%
Mortgage Type
Purchase Money Mortgage
Create a Home Valuation Report for This Property
The Home Valuation Report is an in-depth analysis detailing your home's value as well as a comparison with similar homes in the area
Home Values in the Area
Average Home Value in this Area
Purchase History
| Date | Buyer | Sale Price | Title Company |
|---|---|---|---|
| Stone Christopher P | -- | Chicago Title Company | |
| Stone Christopher P | $700,000 | Chicago Title Company |
Source: Public Records
Mortgage History
| Date | Status | Borrower | Loan Amount |
|---|---|---|---|
| Open | Stone Christopher P | $575,000 | |
| Closed | Stone Christopher P | $550,000 |
Source: Public Records
Tax History
| Year | Tax Paid | Tax Assessment Tax Assessment Total Assessment is a certain percentage of the fair market value that is determined by local assessors to be the total taxable value of land and additions on the property. | Land | Improvement |
|---|---|---|---|---|
| 2025 | $14,743 | $988,196 | $298,559 | $696,637 |
| 2024 | $14,743 | $968,687 | $292,706 | $682,981 |
| 2023 | $14,438 | $956,556 | $286,967 | $669,589 |
| 2022 | $14,188 | $930,803 | $281,341 | $656,462 |
| 2021 | $14,226 | $912,421 | $275,826 | $643,595 |
| 2020 | $13,495 | $910,000 | $273,000 | $637,000 |
| 2019 | $12,999 | $892,156 | $267,647 | $624,509 |
| 2018 | $12,786 | $874,663 | $262,399 | $612,264 |
| 2017 | $12,333 | $857,513 | $257,254 | $600,259 |
| 2016 | $11,961 | $840,700 | $252,210 | $588,490 |
| 2015 | $11,804 | $828,071 | $248,421 | $579,650 |
| 2014 | $11,681 | $811,852 | $243,555 | $568,297 |
Source: Public Records
Map
Nearby Homes
- 1375 Queens Rd
- 230 Fairlawn Dr
- 2893 Buena Vista Way
- 2686 Shasta Rd
- 1221 Grizzly Peak Blvd
- 1179 Keith Ave
- 1155 Keeler Ave
- 1160 Miller Ave
- 1165 Cragmont Ave
- 20 Stevenson Ave
- 1110 Sterling Ave
- 2501 Rose Walk
- 1698 La Loma Ave Unit 1698
- 2600 Hilgard Ave
- 1119 Miller Ave
- 2700 Le Conte Ave Unit 301
- 2700 Le Conte Ave Unit 402
- 1100 Miller Ave
- 1106 Cragmont Ave
- 2477 Virginia St
Your Personal Tour Guide
Ask me questions while you tour the home.