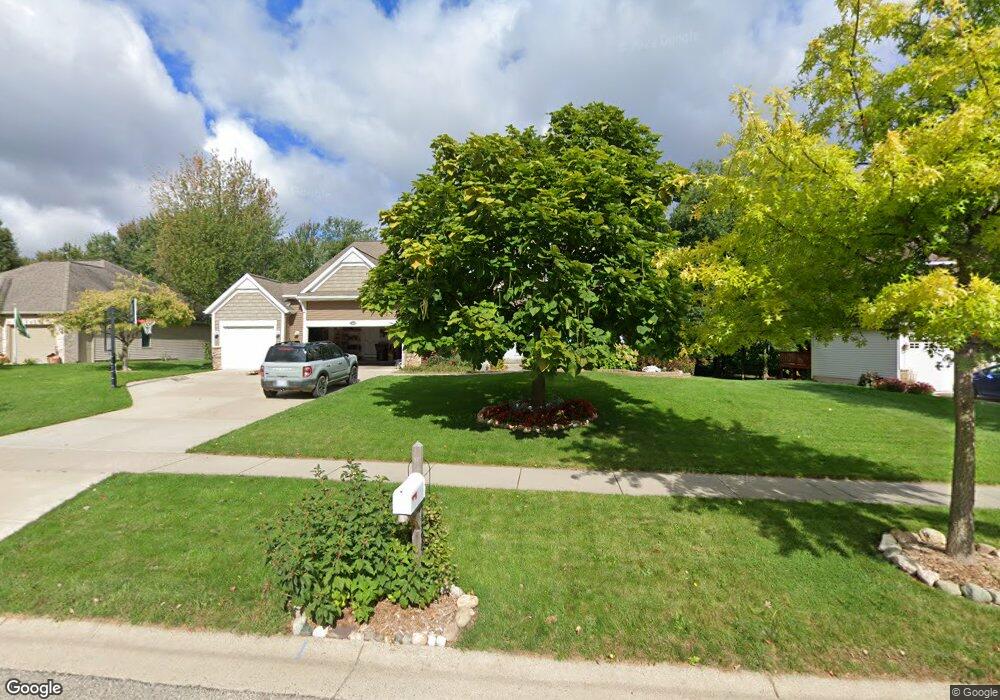
1360 Sanborn Dr Dewitt, MI 48820
Estimated Value: $543,603 - $635,000
4
Beds
3
Baths
2,892
Sq Ft
$203/Sq Ft
Est. Value
About This Home
This home is located at 1360 Sanborn Dr, Dewitt, MI 48820 and is currently estimated at $586,151, approximately $202 per square foot. 1360 Sanborn Dr is a home located in Clinton County with nearby schools including Schavey Road Elementary School, Herbison Woods Elementary School, and Scott Elementary School.
Ownership History
Date
Name
Owned For
Owner Type
Purchase Details
Closed on
Dec 12, 2025
Sold by
Moundros Kirk A and Moundros Nicole
Bought by
Nicole Moundros Trust and Moundros
Current Estimated Value
Purchase Details
Closed on
Dec 19, 2012
Sold by
Moundros Kirk A and Moundros Nicole
Bought by
Moundros Kirk A and Moundros Nicole
Home Financials for this Owner
Home Financials are based on the most recent Mortgage that was taken out on this home.
Original Mortgage
$252,000
Interest Rate
3.3%
Mortgage Type
New Conventional
Purchase Details
Closed on
Apr 1, 2011
Sold by
Eastbrook Homes Inc
Bought by
Moundros Kirk
Home Financials for this Owner
Home Financials are based on the most recent Mortgage that was taken out on this home.
Original Mortgage
$247,780
Interest Rate
5.04%
Mortgage Type
New Conventional
Purchase Details
Closed on
Jan 14, 2011
Sold by
Sr Land Investments Llc
Bought by
Eastbrook Homes Inc
Create a Home Valuation Report for This Property
The Home Valuation Report is an in-depth analysis detailing your home's value as well as a comparison with similar homes in the area
Home Values in the Area
Average Home Value in this Area
Purchase History
| Date | Buyer | Sale Price | Title Company |
|---|---|---|---|
| Nicole Moundros Trust | -- | None Listed On Document | |
| Moundros Kirk A | -- | Title Direct Llc | |
| Moundros Kirk | $309,733 | First American Title Ins Co | |
| Eastbrook Homes Inc | $38,150 | None Available |
Source: Public Records
Mortgage History
| Date | Status | Borrower | Loan Amount |
|---|---|---|---|
| Previous Owner | Moundros Kirk A | $252,000 | |
| Previous Owner | Moundros Kirk | $247,780 |
Source: Public Records
Tax History
| Year | Tax Paid | Tax Assessment Tax Assessment Total Assessment is a certain percentage of the fair market value that is determined by local assessors to be the total taxable value of land and additions on the property. | Land | Improvement |
|---|---|---|---|---|
| 2025 | $8,103 | $277,000 | $40,000 | $237,000 |
| 2024 | $42 | $260,500 | $36,800 | $223,700 |
| 2023 | $4,754 | $233,300 | $0 | $0 |
| 2022 | $7,319 | $215,100 | $31,400 | $183,700 |
| 2021 | $7,106 | $204,500 | $29,800 | $174,700 |
| 2020 | $6,914 | $201,900 | $29,200 | $172,700 |
| 2019 | $6,647 | $198,700 | $27,400 | $171,300 |
| 2018 | $6,358 | $192,500 | $25,200 | $167,300 |
| 2017 | $6,273 | $186,100 | $24,600 | $161,500 |
| 2016 | $6,201 | $177,400 | $24,200 | $153,200 |
| 2015 | $6,211 | $170,200 | $0 | $0 |
| 2011 | -- | $86,900 | $0 | $0 |
Source: Public Records
Map
Nearby Homes
- 1587 Wellman Rd
- 1465 Primrose Ln
- 14055 Pristine Ct
- 14065 Pristine Ct
- 14070 Pristine Ct
- 14103 Ambrosia Ave
- 13132 Addington Dr
- 12615 Kruger Ln
- 14211 Myers Rd
- 1694 W Solon Rd
- 0 W Solon Rd
- 2407 W Clark Rd
- 13158 Wood Rd
- E Howe Rd
- 303 W Washington St
- 2984 Moccasin Dr
- 603 Cherry St
- 2956 Moccasin Dr
- 2969 Moccasin Dr
- 13865 Kaleidoscope Dr
- 1380 Sanborn Dr
- 1340 Sanborn Dr
- 1400 Sanborn Dr
- 1330 Sanborn Dr
- 1347 Sanborn Dr
- 1365 Sanborn Dr
- 1333 Sanborn Dr
- 1331 Linden Cove
- 1420 Sanborn Dr
- 1407 Sanborn Dr
- 13242 Willow Grove Dr
- 1341 Linden Cove
- 1321 Linden Cove
- 13258 Willow Grove Dr
- 1440 Sanborn Dr
- 1332 Poppy Ln
- 1433 Sanborn Dr
- 1301 Linden Cove
- 1349 Poppy Ln
- 13270 Willow Grove Dr
Your Personal Tour Guide
Ask me questions while you tour the home.