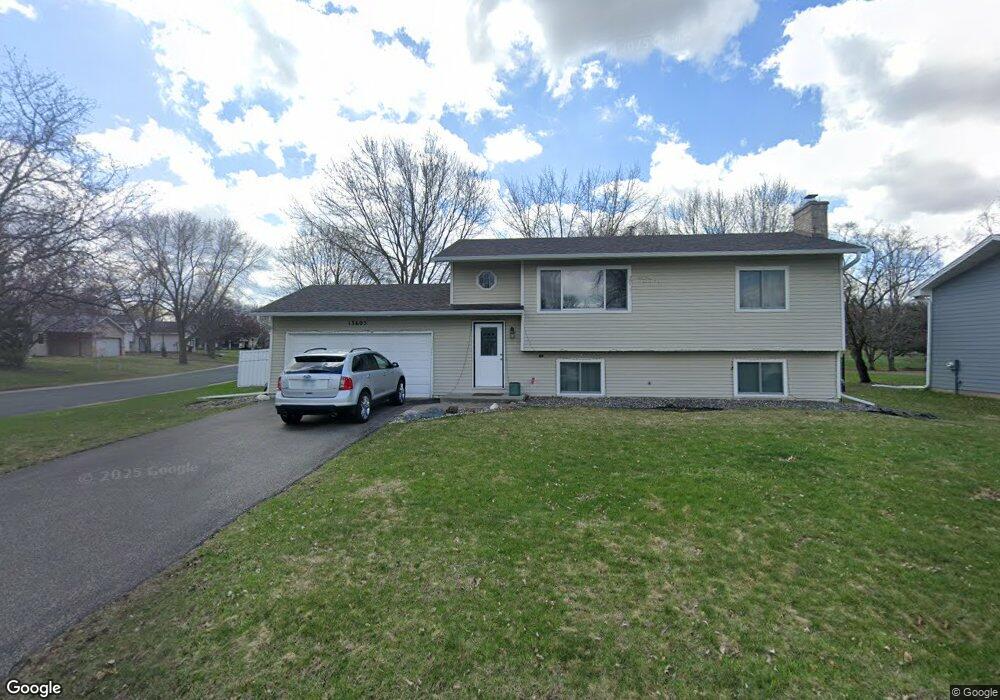
13605 87th Ave N Maple Grove, MN 55369
Estimated Value: $379,000 - $413,000
4
Beds
2
Baths
1,780
Sq Ft
$223/Sq Ft
Est. Value
About This Home
This home is located at 13605 87th Ave N, Maple Grove, MN 55369 and is currently estimated at $396,879, approximately $222 per square foot. 13605 87th Ave N is a home located in Hennepin County with nearby schools including Rice Lake Elementary School, Maple Grove Middle School, and Maple Grove Senior High School.
Ownership History
Date
Name
Owned For
Owner Type
Purchase Details
Closed on
Jun 7, 2019
Sold by
Baysudee Walled and Baysudee Nabila
Bought by
Tensen Jonathan and Flom Cara
Current Estimated Value
Home Financials for this Owner
Home Financials are based on the most recent Mortgage that was taken out on this home.
Original Mortgage
$290,903
Outstanding Balance
$255,256
Interest Rate
4%
Mortgage Type
New Conventional
Estimated Equity
$141,623
Purchase Details
Closed on
Jun 25, 2018
Sold by
Baysudee Wajid and Baysudee Khatera
Bought by
Baysudee Walled and Baysudee Nabila
Purchase Details
Closed on
Jul 24, 2015
Sold by
Potter Connie K and Graves Amy C
Bought by
Baysudee Wajid
Purchase Details
Closed on
May 31, 2006
Sold by
Haukos Jessica
Bought by
Potter Connie K and Graves Amy C
Purchase Details
Closed on
Sep 27, 2001
Sold by
Pedersen Dean and Pedersen Anita
Bought by
Haukos Jessica
Purchase Details
Closed on
Feb 26, 1997
Sold by
Werder Jonathan C and Werder Sheila A
Bought by
Pedersen Dean A
Create a Home Valuation Report for This Property
The Home Valuation Report is an in-depth analysis detailing your home's value as well as a comparison with similar homes in the area
Home Values in the Area
Average Home Value in this Area
Purchase History
| Date | Buyer | Sale Price | Title Company |
|---|---|---|---|
| Tensen Jonathan | $299,900 | Titlesmart Inc | |
| Baysudee Walled | -- | Title Specialists Inc | |
| Baysudee Wajid | $235,000 | Liberty Title Inc | |
| Potter Connie K | $242,100 | -- | |
| Haukos Jessica | $180,000 | -- | |
| Pedersen Dean A | $122,500 | -- |
Source: Public Records
Mortgage History
| Date | Status | Borrower | Loan Amount |
|---|---|---|---|
| Open | Tensen Jonathan | $290,903 |
Source: Public Records
Tax History Compared to Growth
Tax History
| Year | Tax Paid | Tax Assessment Tax Assessment Total Assessment is a certain percentage of the fair market value that is determined by local assessors to be the total taxable value of land and additions on the property. | Land | Improvement |
|---|---|---|---|---|
| 2024 | $4,100 | $349,200 | $121,600 | $227,600 |
| 2023 | $3,739 | $325,100 | $96,800 | $228,300 |
| 2022 | $3,386 | $334,400 | $93,000 | $241,400 |
| 2021 | $3,173 | $288,300 | $79,000 | $209,300 |
| 2020 | $3,106 | $267,700 | $63,500 | $204,200 |
| 2019 | $3,110 | $250,800 | $60,900 | $189,900 |
| 2018 | $3,065 | $238,500 | $59,300 | $179,200 |
| 2017 | $2,857 | $209,900 | $58,000 | $151,900 |
| 2016 | $2,814 | $204,700 | $58,000 | $146,700 |
| 2015 | $3,162 | $202,900 | $65,000 | $137,900 |
| 2014 | -- | $187,700 | $62,300 | $125,400 |
Source: Public Records
Map
Nearby Homes
- 8567 Xenium Ln N
- 13590 89th Ave N
- 13898 85th Place N
- 8829 Dallas Ln N
- 13870 85th Ave N
- 14085 85th Place N
- 8473 Rice Lake Rd
- 13667 84th Place N
- 8461 Rice Lake Rd
- 8735 Rosewood Ln N
- 13773 84th Place N
- 13351 90th Place N
- 8405 Underwood Ln N
- 8949 Rosewood Ln N
- 12769 88th Ave N
- 12989 84th Ave N
- 9061 Underwood Ln N
- 12598 84th Place N
- 12509 88th Ave N
- 8326 Oakview Ct N
- 13635 87th Ave N
- 8689 Xenium Ln N
- 13665 87th Ave N
- 8694 Xenium Ln N
- 8679 Xenium Ln N
- 13600 87th Ave N
- 13560 87th Ave N
- 13630 87th Ave N
- 8686 Xenium Ln N
- 13695 87th Ave N
- 13660 87th Ave N
- 8638 Zinnia Way N
- 8638 N Zinnia Way
- 8638 8638 Zinnia-Way-n
- 13530 87th Ave N
- 8670 Xenium Ln N
- 8669 Xenium Ln N
- 8644 N Zinnia Way
- 13690 87th Ave N
- 13715 87th Ave N