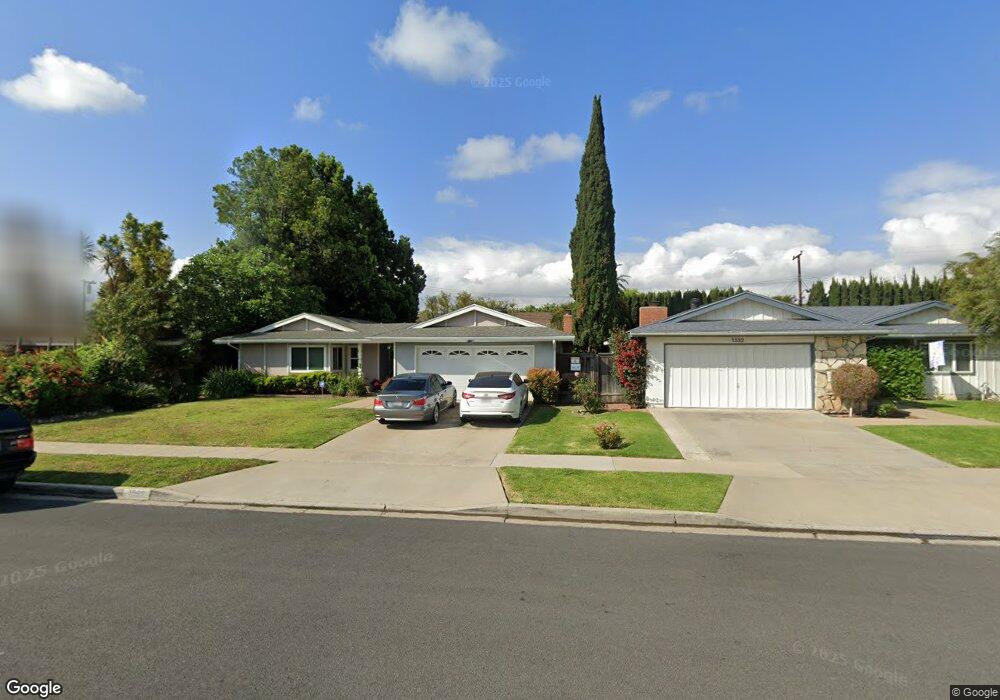
13654 Red Hill Ave Unit G Tustin, CA 92780
Estimated Value: $642,000 - $918,000
3
Beds
2
Baths
1,353
Sq Ft
$568/Sq Ft
Est. Value
About This Home
This home is located at 13654 Red Hill Ave Unit G, Tustin, CA 92780 and is currently estimated at $768,230, approximately $567 per square foot. 13654 Red Hill Ave Unit G is a home located in Orange County with nearby schools including C. E. Utt Middle School, Tustin High School, and Red Hill Lutheran.
Ownership History
Date
Name
Owned For
Owner Type
Purchase Details
Closed on
May 3, 2000
Sold by
Eduardo Cajamarca and Eduardo Gladys I
Bought by
Sweeney Toni A
Current Estimated Value
Home Financials for this Owner
Home Financials are based on the most recent Mortgage that was taken out on this home.
Original Mortgage
$140,000
Outstanding Balance
$48,401
Interest Rate
8.15%
Estimated Equity
$719,829
Purchase Details
Closed on
Nov 11, 1997
Sold by
Co Rufino T and Co Rose Q
Bought by
Cajamarca Eduardo A and Cajamarca Gladys I
Home Financials for this Owner
Home Financials are based on the most recent Mortgage that was taken out on this home.
Original Mortgage
$130,518
Interest Rate
7.22%
Mortgage Type
FHA
Purchase Details
Closed on
Nov 5, 1996
Sold by
Garcia Pamela J
Bought by
Co Rufino T and Co Rose Q
Create a Home Valuation Report for This Property
The Home Valuation Report is an in-depth analysis detailing your home's value as well as a comparison with similar homes in the area
Home Values in the Area
Average Home Value in this Area
Purchase History
| Date | Buyer | Sale Price | Title Company |
|---|---|---|---|
| Sweeney Toni A | $175,000 | United Title Company | |
| Cajamarca Eduardo A | $135,000 | Old Republic Title Company | |
| Co Rufino T | $115,000 | Old Republic Title Company |
Source: Public Records
Mortgage History
| Date | Status | Borrower | Loan Amount |
|---|---|---|---|
| Open | Sweeney Toni A | $140,000 | |
| Previous Owner | Cajamarca Eduardo A | $130,518 |
Source: Public Records
Tax History Compared to Growth
Tax History
| Year | Tax Paid | Tax Assessment Tax Assessment Total Assessment is a certain percentage of the fair market value that is determined by local assessors to be the total taxable value of land and additions on the property. | Land | Improvement |
|---|---|---|---|---|
| 2025 | $3,255 | $268,959 | $154,930 | $114,029 |
| 2024 | $3,255 | $263,686 | $151,892 | $111,794 |
| 2023 | $3,166 | $258,516 | $148,914 | $109,602 |
| 2022 | $3,108 | $253,448 | $145,995 | $107,453 |
| 2021 | $3,047 | $248,479 | $143,132 | $105,347 |
| 2020 | $3,030 | $245,932 | $141,665 | $104,267 |
| 2019 | $2,961 | $241,110 | $138,887 | $102,223 |
| 2018 | $2,913 | $236,383 | $136,164 | $100,219 |
| 2017 | $2,864 | $231,749 | $133,495 | $98,254 |
| 2016 | $2,814 | $227,205 | $130,877 | $96,328 |
| 2015 | $2,896 | $223,793 | $128,911 | $94,882 |
| 2014 | $2,825 | $219,410 | $126,386 | $93,024 |
Source: Public Records
Map
Nearby Homes
- 13511 Epping Way
- 1621 Bryan Ave
- 1370 San Juan St
- 13631 Fielding Dr
- 13371 Epping Way
- 1431 Mauna Loa Rd
- 14032 Woodlawn Ave
- 1209 E 1st St
- 1071 & 1073 Walnut St
- 1091 Bonita St
- 1042 San Juan St
- 13121 Dean St
- 1121 E 1st St
- 1125 E 1st St
- 157 Balsawood
- 153 Balsawood
- 1112 1114 Napa St
- 164 & 172 Preble Dr
- 1881 Mitchell Ave Unit 63
- 1161 Packers Cir Unit 102
- 13654 Red Hill Ave Unit F
- 13654 Red Hill Ave
- 13654 Red Hill Ave Unit 14
- 13654 Red Hill Ave Unit 21
- 13654 Red Hill Ave Unit C
- 13654 Red Hill Ave Unit A
- 13654 Red Hill Ave Unit H
- 13654 Red Hill Ave Unit D
- 13654 Red Hill Ave Unit K
- 13654 Red Hill Ave Unit J
- 13654 Red Hill Ave Unit L
- 13654 Red Hill Ave Unit 18
- 13654 Red Hill Ave Unit E
- 13654 Red Hill Ave Unit B
- 1532 Lance Dr
- 13652 Red Hill Ave Unit 9
- 13652 Red Hill Ave Unit D
- 13652 Red Hill Ave Unit 7(letter A)
- 13652 Red Hill Ave Unit 7(or A)
- 13652 Red Hill Ave Unit A