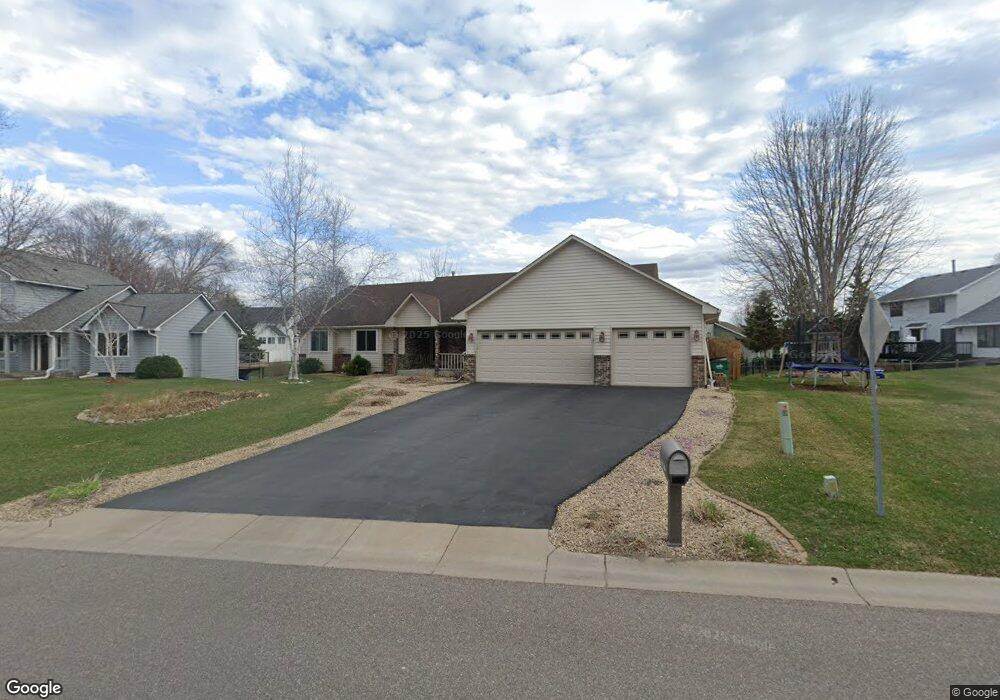
13693 96th Ave N Maple Grove, MN 55369
Estimated Value: $508,949 - $548,000
3
Beds
3
Baths
1,840
Sq Ft
$286/Sq Ft
Est. Value
About This Home
This home is located at 13693 96th Ave N, Maple Grove, MN 55369 and is currently estimated at $526,987, approximately $286 per square foot. 13693 96th Ave N is a home located in Hennepin County with nearby schools including Fernbrook Elementary School, Osseo Middle School, and Maple Grove Senior High School.
Ownership History
Date
Name
Owned For
Owner Type
Purchase Details
Closed on
Mar 24, 2017
Sold by
Piotraschke John D and Piotraschke Cheryl Ab
Bought by
Greene Christopher and Greene Sandra
Current Estimated Value
Home Financials for this Owner
Home Financials are based on the most recent Mortgage that was taken out on this home.
Original Mortgage
$295,200
Outstanding Balance
$150,900
Interest Rate
4.21%
Mortgage Type
New Conventional
Estimated Equity
$376,087
Purchase Details
Closed on
Jul 26, 2002
Sold by
Benincasa Michael A and Benincasa Angelina V
Bought by
Relocation Resources International Inc
Purchase Details
Closed on
May 18, 2001
Sold by
Palkovich Jeff G and Palkovich Barbara J
Bought by
Benincasa Michael A and Benincasa Angelina
Purchase Details
Closed on
May 14, 1996
Sold by
Hartness Carl B
Bought by
Palkovich Jeff G
Create a Home Valuation Report for This Property
The Home Valuation Report is an in-depth analysis detailing your home's value as well as a comparison with similar homes in the area
Home Values in the Area
Average Home Value in this Area
Purchase History
| Date | Buyer | Sale Price | Title Company |
|---|---|---|---|
| Greene Christopher | $365,000 | None Available | |
| Relocation Resources International Inc | $275,000 | -- | |
| Piotraschke John | $275,000 | -- | |
| Benincasa Michael A | $257,000 | -- | |
| Palkovich Jeff G | $189,500 | -- |
Source: Public Records
Mortgage History
| Date | Status | Borrower | Loan Amount |
|---|---|---|---|
| Open | Greene Christopher | $295,200 |
Source: Public Records
Tax History
| Year | Tax Paid | Tax Assessment Tax Assessment Total Assessment is a certain percentage of the fair market value that is determined by local assessors to be the total taxable value of land and additions on the property. | Land | Improvement |
|---|---|---|---|---|
| 2024 | $5,938 | $490,200 | $105,300 | $384,900 |
| 2023 | $5,835 | $497,500 | $105,300 | $392,200 |
| 2022 | $5,021 | $467,000 | $59,300 | $407,700 |
| 2021 | $5,221 | $413,700 | $68,300 | $345,400 |
| 2020 | $5,215 | $423,000 | $85,300 | $337,700 |
| 2019 | $4,954 | $402,100 | $78,000 | $324,100 |
| 2018 | $4,790 | $363,300 | $54,000 | $309,300 |
| 2017 | $4,963 | $344,000 | $84,000 | $260,000 |
| 2016 | $4,808 | $329,800 | $75,000 | $254,800 |
| 2015 | $4,686 | $314,100 | $67,000 | $247,100 |
| 2014 | -- | $302,500 | $72,000 | $230,500 |
Source: Public Records
Map
Nearby Homes
- 9244 Zinnia Ln N
- 13940 90th Place N
- 13327 Territorial Cir N
- 13485 Territorial Cir N
- 13154 90th Place N
- 13152 90th Place N
- 10625 Juneau Ln N
- 8940 Yucca Ln N
- 13810 102nd Ct N
- 9323 Magnolia Ln N
- 9482 Niagara Ln N
- 12635 91st Ave N
- 10269 Chesshire Ln N
- 15064 92nd Place N
- 14709 Lanewood Ct
- 14714 Lanewood Ct
- 14700 105th Place N
- 13630 87th Ave N
- 12443 90th Ave N
- 14453 103rd Place N
- 13671 96th Ave N
- 13772 95th Place N
- 13688 95th Place N
- 13666 95th Place N
- 13740 95th Place N
- 13649 96th Ave N
- 13714 96th Ave N
- 13624 95th Place N
- 13682 96th Ave N
- 13746 96th Ave N
- 13592 95th Place N
- 13637 96th Ave N
- 13570 95th Place N
- 13767 95th Place N
- 13731 95th Place N
- 13778 96th Ave N
- 13653 95th Place N
- 13640 96th Ave N
- 13755 95th Place N
- 13548 95th Place N
Your Personal Tour Guide
Ask me questions while you tour the home.