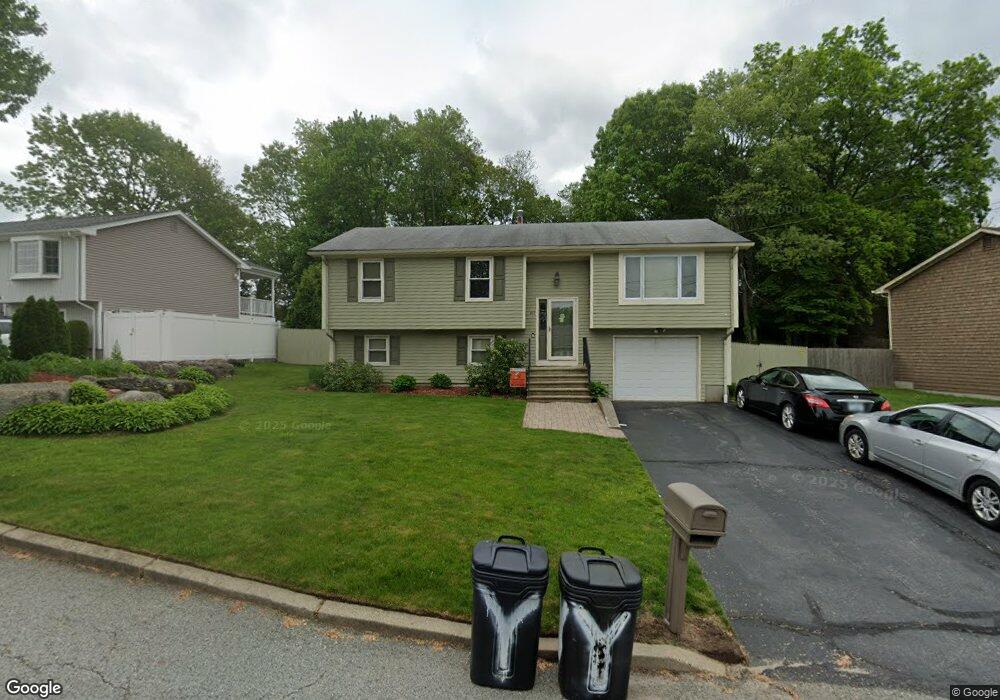
137 Birchwood Dr Unit Dr. Cranston, RI 02920
Thornton NeighborhoodEstimated Value: $510,000 - $628,000
4
Beds
2
Baths
1,204
Sq Ft
$464/Sq Ft
Est. Value
About This Home
This home is located at 137 Birchwood Dr Unit Dr., Cranston, RI 02920 and is currently estimated at $558,667, approximately $464 per square foot. 137 Birchwood Dr Unit Dr. is a home located in Providence County with nearby schools including Stone Hill School, Western Hills Middle School, and Cranston High School West.
Ownership History
Date
Name
Owned For
Owner Type
Purchase Details
Closed on
Dec 28, 2021
Sold by
Williams Courtenay L
Bought by
Verrocchio Raymond D and Verrocchio Courtney E
Current Estimated Value
Home Financials for this Owner
Home Financials are based on the most recent Mortgage that was taken out on this home.
Original Mortgage
$352,000
Outstanding Balance
$323,082
Interest Rate
3.11%
Mortgage Type
Purchase Money Mortgage
Estimated Equity
$235,585
Purchase Details
Closed on
Sep 7, 2012
Sold by
R A Decesare Builders
Bought by
Williams Courtenay L
Home Financials for this Owner
Home Financials are based on the most recent Mortgage that was taken out on this home.
Original Mortgage
$213,750
Interest Rate
3.52%
Create a Home Valuation Report for This Property
The Home Valuation Report is an in-depth analysis detailing your home's value as well as a comparison with similar homes in the area
Home Values in the Area
Average Home Value in this Area
Purchase History
| Date | Buyer | Sale Price | Title Company |
|---|---|---|---|
| Verrocchio Raymond D | $440,000 | None Available | |
| Verrocchio Raymond D | $440,000 | None Available | |
| Williams Courtenay L | -- | -- | |
| Williams Courtenay L | -- | -- |
Source: Public Records
Mortgage History
| Date | Status | Borrower | Loan Amount |
|---|---|---|---|
| Open | Verrocchio Raymond D | $352,000 | |
| Closed | Verrocchio Raymond D | $352,000 | |
| Previous Owner | Williams Courtenay L | $213,750 | |
| Previous Owner | Williams Courtenay L | $100,000 |
Source: Public Records
Tax History Compared to Growth
Tax History
| Year | Tax Paid | Tax Assessment Tax Assessment Total Assessment is a certain percentage of the fair market value that is determined by local assessors to be the total taxable value of land and additions on the property. | Land | Improvement |
|---|---|---|---|---|
| 2025 | $5,966 | $429,800 | $131,300 | $298,500 |
| 2024 | $5,850 | $429,800 | $131,300 | $298,500 |
| 2023 | $5,644 | $298,600 | $94,300 | $204,300 |
| 2022 | $5,527 | $298,600 | $94,300 | $204,300 |
| 2021 | $5,375 | $298,600 | $94,300 | $204,300 |
| 2020 | $5,344 | $257,300 | $94,300 | $163,000 |
| 2019 | $5,344 | $257,300 | $94,300 | $163,000 |
| 2018 | $5,221 | $257,300 | $94,300 | $163,000 |
| 2017 | $4,980 | $217,100 | $75,500 | $141,600 |
| 2016 | $4,874 | $217,100 | $75,500 | $141,600 |
| 2015 | $4,874 | $217,100 | $75,500 | $141,600 |
| 2014 | $4,417 | $193,400 | $75,500 | $117,900 |
Source: Public Records
Map
Nearby Homes
- 51 Stone Dr
- 11 Red Robin Rd
- 134 Lake Garden Dr
- 26 Rachela St
- 118 Westfield Dr
- 17 Woodview Dr
- 20 Wild Berry Dr
- 1603 Plainfield Pike Unit D5
- 1603 Plainfield Pike Unit E2
- 41 Yeoman Ave
- 25 Loomis St
- 27 Nardolillo St
- 1448 Plainfield Pike
- 9 Baker St
- 38 Mill St
- 91 Curry Rd
- 50 Tacoma St
- 0 Plainfield Pike Unit 1374314
- 26 Scituate Farms Dr
- 16 Shaw Ave
- 137 Birchwood Dr
- 133 Birchwood Dr
- 145 Birchwood Dr
- 127 Birchwood Dr
- 35 Lake Garden Dr
- 45 Lake Garden Dr
- 140 Birchwood Dr
- 146 Birchwood Dr
- 121 Birchwood Dr
- 33 Blue Jay Dr
- 53 Lake Garden Dr
- 25 Lake Garden Dr
- 16 Swallow Dr
- 26 Blue Jay Dr
- 126 Birchwood Dr
- 115 Birchwood Dr
- 61 Lake Garden Dr
- 25 Blue Jay Dr
- 24 Swallow Dr
- 20 Blue Jay Dr