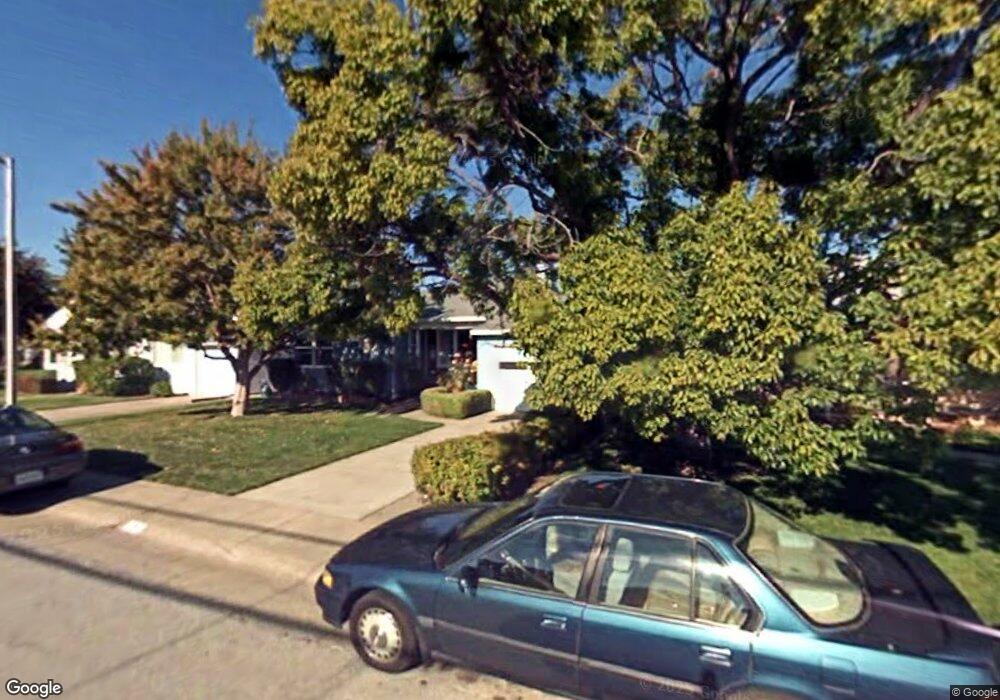
137 Poinsettia Ave San Mateo, CA 94403
Hillsdale NeighborhoodEstimated Value: $1,799,000 - $2,066,452
3
Beds
2
Baths
1,720
Sq Ft
$1,129/Sq Ft
Est. Value
About This Home
This home is located at 137 Poinsettia Ave, San Mateo, CA 94403 and is currently estimated at $1,941,613, approximately $1,128 per square foot. 137 Poinsettia Ave is a home located in San Mateo County with nearby schools including George Hall Elementary School, Abbott Middle School, and Hillsdale High School.
Ownership History
Date
Name
Owned For
Owner Type
Purchase Details
Closed on
Jul 5, 2016
Sold by
Alexander Dennis Gregory
Bought by
Alexander Dennis Gregory and Alexander Revocable L Dennis G
Current Estimated Value
Purchase Details
Closed on
Jul 11, 2011
Sold by
Kozier Laura and Bridget Warnock Declaration Tr
Bought by
Alexander Caridad Lallana and Alexander Dennis Gregory
Home Financials for this Owner
Home Financials are based on the most recent Mortgage that was taken out on this home.
Original Mortgage
$579,916
Outstanding Balance
$397,833
Interest Rate
4.45%
Mortgage Type
FHA
Estimated Equity
$1,543,780
Purchase Details
Closed on
Feb 29, 2000
Sold by
Warnock Bridget
Bought by
Warnock Bridget
Purchase Details
Closed on
Feb 14, 2000
Sold by
Warnock Bridget and Warnock Gary
Bought by
Warnock Bridget
Purchase Details
Closed on
Feb 11, 2000
Sold by
Warnock Bridget and Warnock Laura
Bought by
Warnock Bridget
Create a Home Valuation Report for This Property
The Home Valuation Report is an in-depth analysis detailing your home's value as well as a comparison with similar homes in the area
Home Values in the Area
Average Home Value in this Area
Purchase History
| Date | Buyer | Sale Price | Title Company |
|---|---|---|---|
| Alexander Dennis Gregory | -- | None Available | |
| Alexander Caridad L | -- | None Available | |
| Alexander Caridad Lallana | $595,000 | North American Title Co Inc | |
| Warnock Bridget | -- | -- | |
| Warnock Bridget | -- | -- | |
| Warnock Bridget | -- | -- |
Source: Public Records
Mortgage History
| Date | Status | Borrower | Loan Amount |
|---|---|---|---|
| Open | Alexander Caridad Lallana | $579,916 |
Source: Public Records
Tax History Compared to Growth
Tax History
| Year | Tax Paid | Tax Assessment Tax Assessment Total Assessment is a certain percentage of the fair market value that is determined by local assessors to be the total taxable value of land and additions on the property. | Land | Improvement |
|---|---|---|---|---|
| 2025 | $16,012 | $1,081,661 | $373,671 | $707,990 |
| 2023 | $16,012 | $927,433 | $359,162 | $568,271 |
| 2022 | $11,826 | $763,397 | $352,120 | $411,277 |
| 2021 | $11,590 | $748,430 | $345,216 | $403,214 |
| 2020 | $12,305 | $740,758 | $341,677 | $399,081 |
| 2019 | $10,629 | $726,236 | $334,978 | $391,258 |
| 2018 | $10,098 | $711,997 | $328,410 | $383,587 |
| 2017 | $9,902 | $698,038 | $321,971 | $376,067 |
| 2016 | $9,639 | $684,352 | $315,658 | $368,694 |
| 2015 | $8,962 | $639,600 | $310,917 | $328,683 |
| 2014 | $8,641 | $627,072 | $304,827 | $322,245 |
Source: Public Records
Map
Nearby Homes
- 413 Franklin Pkwy
- 3513 Casanova Dr
- 3605 Pacific Blvd
- 94 E 39th Ave
- 53 E 39th Ave
- 367 Derby Ave
- 345 E 39th Ave
- 58 E 39th Ave
- 2868 Baze Rd
- 2835 Alvarado Ave
- 406 E 28th Ave
- 2736 Foster St
- 18 Culver Ct
- 3415 La Selva St
- 3015 Los Prados St Unit 114
- 3001 Los Prados St Unit 104
- 35 28th Ave Unit 106B
- 4111 Beresford St
- 3045 Los Prados St Unit 218
- 101 Blossom Cir Unit H
- 143 Poinsettia Ave
- 133 Poinsettia Ave
- 147 Poinsettia Ave
- 127 Poinsettia Ave
- 134 E Hillsdale Blvd
- 144 E Hillsdale Blvd
- 153 Poinsettia Ave
- 123 Poinsettia Ave
- 128 E Hillsdale Blvd Unit E
- 148 E Hillsdale Blvd Unit E
- 138 Poinsettia Ave
- 144 Poinsettia Ave
- 134 Poinsettia Ave
- 124 E Hillsdale Blvd Unit E
- 154 E Hillsdale Blvd Unit E
- 157 Poinsettia Ave
- 117 Poinsettia Ave
- 148 Poinsettia Ave
- 128 Poinsettia Ave
- 154 Poinsettia Ave