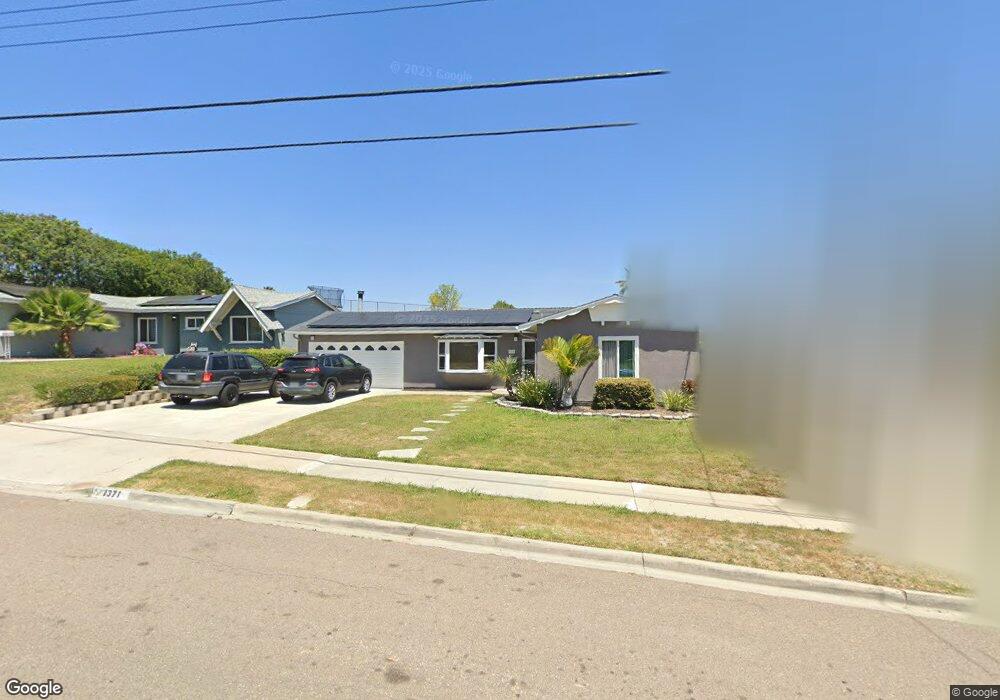
1371 Walbollen St Spring Valley, CA 91977
Estimated Value: $603,000 - $709,000
3
Beds
1
Bath
1,000
Sq Ft
$656/Sq Ft
Est. Value
About This Home
This home is located at 1371 Walbollen St, Spring Valley, CA 91977 and is currently estimated at $656,308, approximately $656 per square foot. 1371 Walbollen St is a home located in San Diego County with nearby schools including Avondale Elementary School, Science, Technology, Engineering, Arts, And Math Academy, and Mount Miguel High School.
Ownership History
Date
Name
Owned For
Owner Type
Purchase Details
Closed on
Dec 6, 2016
Sold by
King David M and King Eva M
Bought by
King David M and King Eva M
Current Estimated Value
Home Financials for this Owner
Home Financials are based on the most recent Mortgage that was taken out on this home.
Original Mortgage
$320,003
Outstanding Balance
$256,219
Interest Rate
3.25%
Mortgage Type
FHA
Estimated Equity
$400,089
Purchase Details
Closed on
Aug 11, 1997
Sold by
King Dora T
Bought by
King David M and King Eva M
Home Financials for this Owner
Home Financials are based on the most recent Mortgage that was taken out on this home.
Original Mortgage
$19,000
Interest Rate
6.95%
Purchase Details
Closed on
Nov 13, 1992
Purchase Details
Closed on
Jul 13, 1989
Purchase Details
Closed on
Oct 6, 1983
Create a Home Valuation Report for This Property
The Home Valuation Report is an in-depth analysis detailing your home's value as well as a comparison with similar homes in the area
Home Values in the Area
Average Home Value in this Area
Purchase History
| Date | Buyer | Sale Price | Title Company |
|---|---|---|---|
| King David M | -- | Lawyers Title | |
| King David M | -- | United Title Company | |
| -- | $128,500 | -- | |
| -- | $96,000 | -- | |
| -- | $60,100 | -- |
Source: Public Records
Mortgage History
| Date | Status | Borrower | Loan Amount |
|---|---|---|---|
| Open | King David M | $320,003 | |
| Closed | King David M | $19,000 |
Source: Public Records
Tax History
| Year | Tax Paid | Tax Assessment Tax Assessment Total Assessment is a certain percentage of the fair market value that is determined by local assessors to be the total taxable value of land and additions on the property. | Land | Improvement |
|---|---|---|---|---|
| 2025 | $2,648 | $180,401 | $68,644 | $111,757 |
| 2024 | $2,648 | $176,865 | $67,299 | $109,566 |
| 2023 | $2,557 | $173,398 | $65,980 | $107,418 |
| 2022 | $2,502 | $169,999 | $64,687 | $105,312 |
| 2021 | $2,483 | $166,667 | $63,419 | $103,248 |
| 2020 | $2,375 | $164,959 | $62,769 | $102,190 |
| 2019 | $2,337 | $161,726 | $61,539 | $100,187 |
| 2018 | $2,248 | $158,556 | $60,333 | $98,223 |
| 2017 | $830 | $155,448 | $59,150 | $96,298 |
| 2016 | $2,086 | $152,401 | $57,991 | $94,410 |
| 2015 | $2,066 | $150,112 | $57,120 | $92,992 |
| 2014 | $2,032 | $147,173 | $56,002 | $91,171 |
Source: Public Records
Map
Nearby Homes
- 1265 Darby St
- 1547 Folkestone St
- 8402 Lockland Ct
- 1670 Enfield St
- 1654 Walbollen St
- 1815 Sweetwater Rd Unit SPC 121
- 8301 Blossom Hill Dr
- 7936-38 Lansing Dr
- 7978 Canton Dr
- 2038 Siegle Dr
- 1333 Helix St
- 1145 Helix St Unit 13
- 1145 Helix St Unit 1
- 2222 Debco Dr
- 8739 Saint George St
- 1040 Gillespie Dr
- 2332 Golden Ave
- 2217 Lyndine St
- 8723 Tyler St
- 753 Elkelton Blvd
- 1379 Walbollen St
- 1365 Walbollen St
- 1359 Walbollen St
- 1372 Walbollen St
- 1405 Walbollen St
- 8306 Stansbury St
- 1366 Walbollen St
- 1351 Walbollen St
- 1360 Walbollen St
- 8307 Stansbury St
- 8312 Stansbury St
- 1345 Walbollen St
- 1354 Walbollen St
- 1406 Walbollen St
- 8330 Stansbury St
- 8315 Stansbury St
- 8338 Stansbury St
- 1412 Walbollen St
- 1346 Walbollen St
- 1339 Walbollen St
Your Personal Tour Guide
Ask me questions while you tour the home.