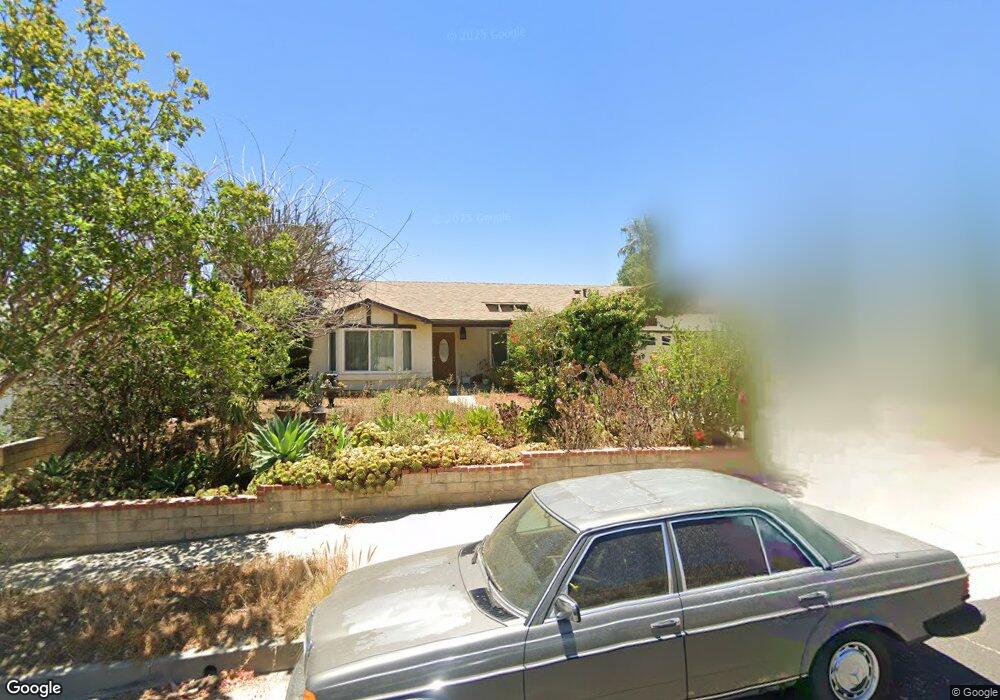
13791 Linfield Ave Sylmar, CA 91342
Estimated Value: $888,822 - $931,000
4
Beds
2
Baths
1,724
Sq Ft
$531/Sq Ft
Est. Value
About This Home
This home is located at 13791 Linfield Ave, Sylmar, CA 91342 and is currently estimated at $916,206, approximately $531 per square foot. 13791 Linfield Ave is a home located in Los Angeles County with nearby schools including Olive Vista Middle School, San Fernando Senior High School, and PUC Community Charter Elementary School.
Ownership History
Date
Name
Owned For
Owner Type
Purchase Details
Closed on
Sep 13, 2023
Sold by
Kajdas Liliana
Bought by
Ghademian Arvin
Current Estimated Value
Home Financials for this Owner
Home Financials are based on the most recent Mortgage that was taken out on this home.
Original Mortgage
$735,842
Outstanding Balance
$720,236
Interest Rate
6.96%
Mortgage Type
FHA
Estimated Equity
$195,970
Purchase Details
Closed on
Feb 10, 2014
Sold by
Kajdas Martin
Bought by
Kajdas Liliana
Purchase Details
Closed on
Sep 23, 2010
Sold by
Osten Richard
Bought by
Kajdas Martin
Purchase Details
Closed on
Jan 7, 2008
Sold by
Kajdas Liliana
Bought by
Kajdas Liliana
Purchase Details
Closed on
Jun 21, 2006
Sold by
Osten Richard A
Bought by
Osten Richard A
Create a Home Valuation Report for This Property
The Home Valuation Report is an in-depth analysis detailing your home's value as well as a comparison with similar homes in the area
Home Values in the Area
Average Home Value in this Area
Purchase History
| Date | Buyer | Sale Price | Title Company |
|---|---|---|---|
| Ghademian Arvin | $761,500 | Fidelity National Title | |
| Kajdas Liliana | -- | None Available | |
| Kajdas Martin | -- | None Available | |
| Kajdas Liliana | -- | None Available | |
| Kajdas Liliana | -- | None Available | |
| Osten Richard A | -- | None Available |
Source: Public Records
Mortgage History
| Date | Status | Borrower | Loan Amount |
|---|---|---|---|
| Open | Ghademian Arvin | $735,842 |
Source: Public Records
Tax History Compared to Growth
Tax History
| Year | Tax Paid | Tax Assessment Tax Assessment Total Assessment is a certain percentage of the fair market value that is determined by local assessors to be the total taxable value of land and additions on the property. | Land | Improvement |
|---|---|---|---|---|
| 2025 | $9,544 | $776,424 | $541,212 | $235,212 |
| 2024 | $9,544 | $761,200 | $530,600 | $230,600 |
| 2023 | $4,989 | $388,587 | $190,523 | $198,064 |
| 2022 | $4,765 | $380,969 | $186,788 | $194,181 |
| 2021 | $4,700 | $373,500 | $183,126 | $190,374 |
| 2019 | $4,563 | $362,424 | $177,696 | $184,728 |
| 2018 | $4,460 | $355,318 | $174,212 | $181,106 |
| 2016 | $4,252 | $341,523 | $167,449 | $174,074 |
| 2015 | $4,732 | $380,387 | $170,089 | $210,298 |
| 2014 | $4,296 | $329,806 | $161,704 | $168,102 |
Source: Public Records
Map
Nearby Homes
- 13674 Linfield Ave
- 13765 Algranti Ave
- 13095 Hubbard St Unit 1
- 13189 Herron St
- 13791 Gavina Ave
- 13793 Gavina Ave
- 13670 Garrick Ave
- 13547 Mindora Ave
- 13260 Raven St
- 13166 Aztec St
- 14030 Simshaw Ave
- 13307 Herron St
- 14047 Simshaw Ave
- 13382 Astoria St
- 13450 Lochrin Ln
- 13631 Eldridge Ave
- 13414 Herron St
- 13691 Gavina Ave Unit 420
- 13691 Gavina Ave Unit 480
- 13691 Gavina Ave Unit 574
- 13785 Linfield Ave
- 12940 Aztec St
- 13748 Mindora Ave
- 12914 Aztec St
- 13777 Linfield Ave
- 12929 Aztec St
- 12925 Aztec St
- 13742 Mindora Ave
- 13790 Linfield Ave
- 12943 Aztec St
- 13784 Linfield Ave
- 13734 Mindora Ave
- 13812 Mindora Ave
- 13831 Shablow Ave
- 12900 Aztec St
- 13732 Mindora Ave Unit Awesome View Apartme
- 13732 Mindora Ave
- 12917 Aztec St
- 13776 Linfield Ave
- 22009 Linfield Ln