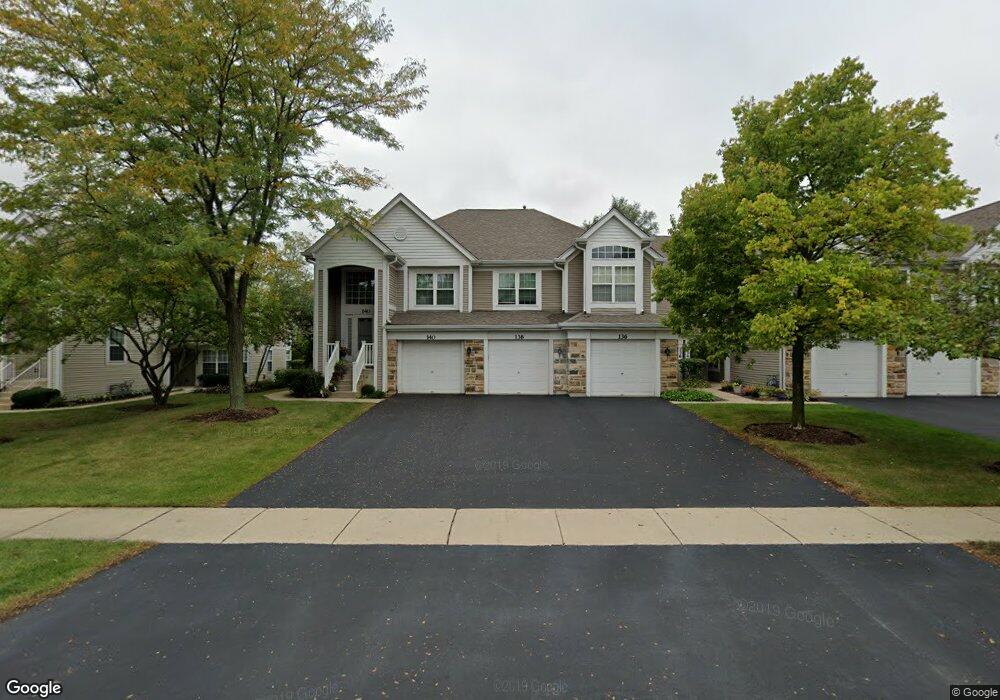
138 Concord Ln Carol Stream, IL 60188
South Carol Stream NeighborhoodEstimated Value: $228,000 - $276,000
Studio
1
Bath
1,018
Sq Ft
$252/Sq Ft
Est. Value
About This Home
This home is located at 138 Concord Ln, Carol Stream, IL 60188 and is currently estimated at $256,593, approximately $252 per square foot. 138 Concord Ln is a home located in DuPage County with nearby schools including Churchill Elementary School, Hadley Junior High School, and Glenbard West High School.
Ownership History
Date
Name
Owned For
Owner Type
Purchase Details
Closed on
May 26, 2010
Sold by
Sherry Joyce T
Bought by
Sherry Joyce T and Joyce T Sherry Living Trust
Current Estimated Value
Purchase Details
Closed on
Dec 10, 2003
Sold by
Kutz Troy and Kutz Julie
Bought by
Sherry Joyce T
Purchase Details
Closed on
Dec 28, 2000
Sold by
Mcguire Jerry T and Mcguire Helena N
Bought by
Kutz Troy and Cox Julie
Home Financials for this Owner
Home Financials are based on the most recent Mortgage that was taken out on this home.
Original Mortgage
$103,200
Interest Rate
7.77%
Mortgage Type
Purchase Money Mortgage
Purchase Details
Closed on
Apr 14, 1994
Sold by
American National Bk & Tr Co Of Chicago
Bought by
Mcguire Jerry T
Home Financials for this Owner
Home Financials are based on the most recent Mortgage that was taken out on this home.
Original Mortgage
$84,650
Interest Rate
8.48%
Mortgage Type
Purchase Money Mortgage
Create a Home Valuation Report for This Property
The Home Valuation Report is an in-depth analysis detailing your home's value as well as a comparison with similar homes in the area
Home Values in the Area
Average Home Value in this Area
Purchase History
| Date | Buyer | Sale Price | Title Company |
|---|---|---|---|
| Sherry Joyce T | -- | None Available | |
| Sherry Joyce T | $160,000 | Ctic | |
| Kutz Troy | $129,000 | -- | |
| Mcguire Jerry T | $106,000 | -- |
Source: Public Records
Mortgage History
| Date | Status | Borrower | Loan Amount |
|---|---|---|---|
| Previous Owner | Kutz Troy | $103,200 | |
| Previous Owner | Mcguire Jerry T | $84,650 | |
| Closed | Kutz Troy | $19,350 |
Source: Public Records
Tax History
| Year | Tax Paid | Tax Assessment Tax Assessment Total Assessment is a certain percentage of the fair market value that is determined by local assessors to be the total taxable value of land and additions on the property. | Land | Improvement |
|---|---|---|---|---|
| 2024 | $4,138 | $69,171 | $7,713 | $61,458 |
| 2023 | $2,171 | $63,670 | $7,100 | $56,570 |
| 2022 | $2,613 | $55,930 | $6,710 | $49,220 |
| 2021 | $2,609 | $54,600 | $6,550 | $48,050 |
| 2020 | $2,582 | $54,090 | $6,490 | $47,600 |
| 2019 | $2,591 | $52,660 | $6,320 | $46,340 |
| 2018 | $2,536 | $48,350 | $5,950 | $42,400 |
| 2017 | $2,588 | $46,570 | $5,730 | $40,840 |
| 2016 | $2,707 | $44,710 | $5,500 | $39,210 |
| 2015 | $2,827 | $42,660 | $5,250 | $37,410 |
| 2014 | $3,274 | $46,430 | $5,430 | $41,000 |
| 2013 | $3,170 | $46,570 | $5,450 | $41,120 |
Source: Public Records
Map
Nearby Homes
- 142 Kennebunk Ct Unit 32
- 1111 Bloomingdale Rd Unit 2A
- 1348 Hartford St
- 266 Shorewood Dr Unit 2A
- 45 Cambridge Ln
- 71 Cambridge Ln
- 118 Windsor Ln
- 2N049 Diane Ave
- 1130 Evergreen Ave Unit 1A
- 462 S President St Unit 302
- 464 S President St Unit 204
- 1N713 Evergreen Ave
- 491 Timber Ridge Dr Unit 102
- 511 Timber Ridge Dr Unit 202A
- 1470 Elizabeth St
- 835 Avon Ct
- 831 Avon Ct
- 1403 Club Dr Unit A
- 1017 Tartan Ct
- 2N417 Amy Ave
- 140 Concord Ln
- 136 Concord Ln Unit 33C
- 134 Concord Ln Unit 2
- 132 Concord Ln
- 142 Concord Ln
- 144 Concord Ln
- 130 Concord Ln
- 146 Concord Ln
- 148 Concord Ln
- 150 Concord Ln
- 126 Concord Ln
- 124 Concord Ln
- 127 Concord Ln
- 133 Concord Ln Unit D133
- 131 Concord Ln
- 139 Concord Ln
- 137 Concord Ln
- 122 Concord Ln
- 129 Concord Ln
- 141 Concord Ln
Your Personal Tour Guide
Ask me questions while you tour the home.