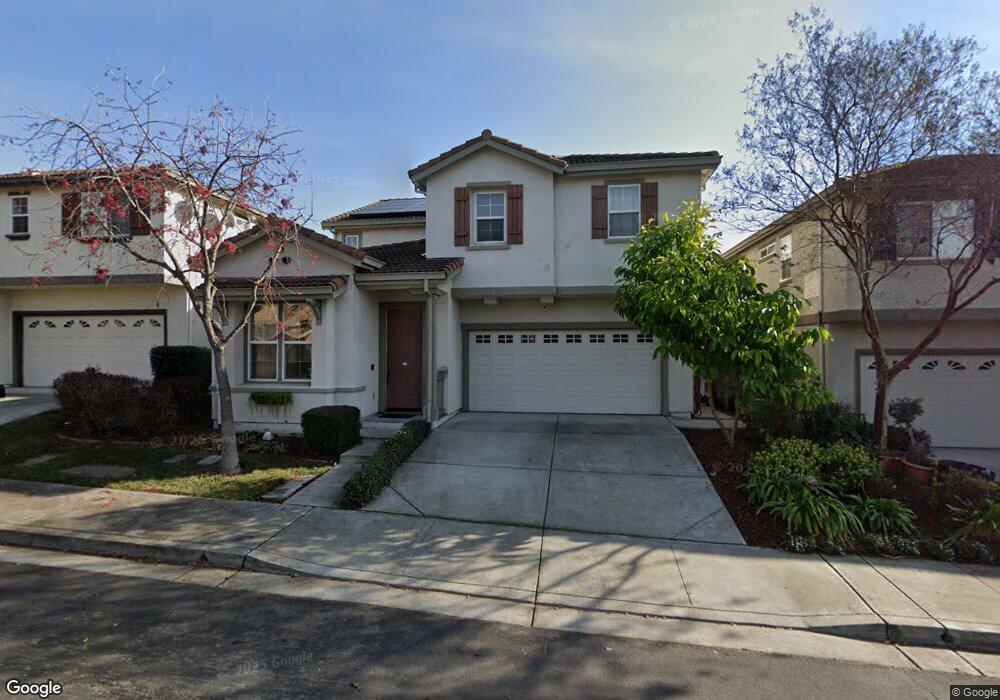
138 Jasmine Ct Union City, CA 94587
Downtown Union City NeighborhoodEstimated Value: $1,762,000 - $1,923,000
5
Beds
3
Baths
2,516
Sq Ft
$735/Sq Ft
Est. Value
About This Home
This home is located at 138 Jasmine Ct, Union City, CA 94587 and is currently estimated at $1,850,344, approximately $735 per square foot. 138 Jasmine Ct is a home located in Alameda County with nearby schools including Guy Jr. Emanuele Elementary School, Cesar Chavez Middle School, and James Logan High School.
Ownership History
Date
Name
Owned For
Owner Type
Purchase Details
Closed on
Mar 12, 2008
Sold by
Fang Sheng Jian and Gao Linda Zhi
Bought by
Fang Sheng Jian
Current Estimated Value
Purchase Details
Closed on
Nov 11, 2004
Sold by
Fang Jian Sheng and Gao Linda Zhi
Bought by
Fang Jian Sheng and Gao Linda Zhi
Home Financials for this Owner
Home Financials are based on the most recent Mortgage that was taken out on this home.
Original Mortgage
$471,000
Outstanding Balance
$234,104
Interest Rate
5.72%
Mortgage Type
New Conventional
Estimated Equity
$1,616,240
Purchase Details
Closed on
Nov 5, 2002
Sold by
Blacksmith Homes Llc
Bought by
Fang Sheng Jian and Gao Linda Zhi
Home Financials for this Owner
Home Financials are based on the most recent Mortgage that was taken out on this home.
Original Mortgage
$483,000
Interest Rate
5.75%
Purchase Details
Closed on
May 9, 2001
Sold by
Len Ashford Iii Llc
Bought by
Greystone Homes Inc
Create a Home Valuation Report for This Property
The Home Valuation Report is an in-depth analysis detailing your home's value as well as a comparison with similar homes in the area
Home Values in the Area
Average Home Value in this Area
Purchase History
| Date | Buyer | Sale Price | Title Company |
|---|---|---|---|
| Fang Sheng Jian | -- | None Available | |
| Fang Jian Sheng | -- | Chicago Title Co | |
| Fang Sheng Jian | $605,000 | Chicago Title Company | |
| Greystone Homes Inc | -- | North American Title Co |
Source: Public Records
Mortgage History
| Date | Status | Borrower | Loan Amount |
|---|---|---|---|
| Open | Fang Jian Sheng | $471,000 | |
| Closed | Fang Sheng Jian | $483,000 |
Source: Public Records
Tax History Compared to Growth
Tax History
| Year | Tax Paid | Tax Assessment Tax Assessment Total Assessment is a certain percentage of the fair market value that is determined by local assessors to be the total taxable value of land and additions on the property. | Land | Improvement |
|---|---|---|---|---|
| 2025 | $12,679 | $868,871 | $262,848 | $613,023 |
| 2024 | $12,679 | $851,700 | $257,695 | $601,005 |
| 2023 | $12,301 | $841,869 | $252,644 | $589,225 |
| 2022 | $12,098 | $818,364 | $247,691 | $577,673 |
| 2021 | $11,830 | $802,186 | $242,836 | $566,350 |
| 2020 | $11,560 | $800,893 | $240,347 | $560,546 |
| 2019 | $11,664 | $785,193 | $235,636 | $549,557 |
| 2018 | $11,397 | $769,800 | $231,016 | $538,784 |
| 2017 | $11,129 | $754,711 | $226,488 | $528,223 |
| 2016 | $10,732 | $739,917 | $222,048 | $517,869 |
| 2015 | $10,532 | $728,807 | $218,714 | $510,093 |
| 2014 | $10,145 | $714,534 | $214,431 | $500,103 |
Source: Public Records
Map
Nearby Homes
- 138 Donoso Plaza
- 126 Bellflower Ln
- 213 Ladera Plaza Unit 13
- 208 Appian Way
- 1027 Chalcedony Terrace
- 217 Appian Way
- 35180 Mount Whitney Terrace
- 355 Appian Way
- 365 Monaco Ave
- 352 Monte Carlo Ave
- 34237 Torrey Pine Ln
- 409 King Ave
- 35560 Monterra Terrace Unit 301
- 1157 Silver St
- 315 Springstone Dr
- 33852 11th St
- 394 Appian Way
- 35784 Linda Dr
- 33848 10th St
- 2224 Peacock Place Unit 3
- 34503 Torrey Pine Ln
- 34498 Jasmine Ct
- 34507 Torrey Pine Ln
- 34502 Jasmine Ct
- 34511 Torrey Pine Ln
- 34506 Jasmine Ct
- 139 Jasmine Ct
- 135 Jasmine Ct
- 131 Jasmine Ct
- 34496 Torrey Pine Ln
- 34485 Torrey Pine Ln
- 34510 Jasmine Ct
- 34500 Torrey Pine Ln
- 34492 Torrey Pine Ln
- 127 Jasmine Ct
- 34499 Jasmine Ct
- 34503 Jasmine Ct
- 34504 Torrey Pine Ln
- 34488 Torrey Pine Ln
- 34519 Torrey Pine Ln