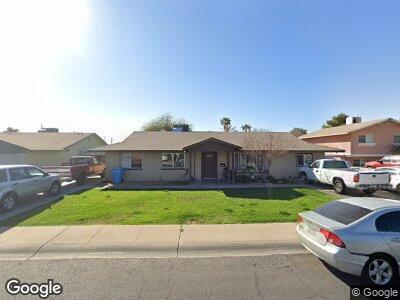
13816 N 34th Ave Phoenix, AZ 85053
Deer Valley NeighborhoodEstimated Value: $295,723 - $370,000
--
Bed
2
Baths
1,380
Sq Ft
$251/Sq Ft
Est. Value
About This Home
This home is located at 13816 N 34th Ave, Phoenix, AZ 85053 and is currently estimated at $346,681, approximately $251 per square foot. 13816 N 34th Ave is a home located in Maricopa County with nearby schools including Acacia Elementary School, Desert Foothills Middle School, and Greenway High School.
Ownership History
Date
Name
Owned For
Owner Type
Purchase Details
Closed on
Dec 21, 2017
Sold by
Ramirez Nadia Lopez
Bought by
Ramirez Joseline Lopez and Ramirez Julissa Lopez
Current Estimated Value
Home Financials for this Owner
Home Financials are based on the most recent Mortgage that was taken out on this home.
Original Mortgage
$114,000
Outstanding Balance
$84,109
Interest Rate
3.9%
Mortgage Type
New Conventional
Estimated Equity
$265,435
Purchase Details
Closed on
Aug 15, 2002
Sold by
Norton Harriet E
Bought by
Ramirez Julissa L and Ramirez Nadia Lopez
Home Financials for this Owner
Home Financials are based on the most recent Mortgage that was taken out on this home.
Original Mortgage
$113,828
Interest Rate
6.43%
Mortgage Type
FHA
Purchase Details
Closed on
Jun 5, 2001
Sold by
Norton Harriet E and Norton Harriet E
Bought by
Norton Harriet E and Harriet Norton Living Trust
Create a Home Valuation Report for This Property
The Home Valuation Report is an in-depth analysis detailing your home's value as well as a comparison with similar homes in the area
Home Values in the Area
Average Home Value in this Area
Purchase History
| Date | Buyer | Sale Price | Title Company |
|---|---|---|---|
| Ramirez Joseline Lopez | -- | First American Title Insuran | |
| Ramirez Julissa L | $115,000 | Chicago Title Insurance Co | |
| Norton Harriet E | -- | -- |
Source: Public Records
Mortgage History
| Date | Status | Borrower | Loan Amount |
|---|---|---|---|
| Open | Ramirez Joseline Lopez | $114,000 | |
| Closed | Ramirez Julisa L | $117,000 | |
| Closed | Ramirez Julissa L | $113,828 |
Source: Public Records
Tax History Compared to Growth
Tax History
| Year | Tax Paid | Tax Assessment Tax Assessment Total Assessment is a certain percentage of the fair market value that is determined by local assessors to be the total taxable value of land and additions on the property. | Land | Improvement |
|---|---|---|---|---|
| 2025 | $1,042 | $9,727 | -- | -- |
| 2024 | $1,022 | $9,264 | -- | -- |
| 2023 | $1,022 | $25,120 | $5,020 | $20,100 |
| 2022 | $986 | $19,070 | $3,810 | $15,260 |
| 2021 | $1,011 | $17,150 | $3,430 | $13,720 |
| 2020 | $984 | $15,620 | $3,120 | $12,500 |
| 2019 | $966 | $14,150 | $2,830 | $11,320 |
| 2018 | $938 | $12,760 | $2,550 | $10,210 |
| 2017 | $936 | $10,820 | $2,160 | $8,660 |
| 2016 | $919 | $10,660 | $2,130 | $8,530 |
| 2015 | $852 | $10,030 | $2,000 | $8,030 |
Source: Public Records
Map
Nearby Homes
- 3411 W Redfield Rd
- 3447 W Dailey St
- 13608 N 33rd Ave
- 3222 W Hearn Rd
- 3136 W Voltaire Ave
- 3116 W Calavar Rd
- 3202 W Joan de Arc Ave
- 13624 N 31st Ave
- 3141 W Joan de Arc Ave
- 14408 N 35th Ave
- 3054 W Redfield Rd
- 3231 W Willow Ave
- 3425 W Acoma Dr
- 3201 W Evans Dr
- 3538 W Willow Ave
- 13801 N 37th Dr
- 3636 W Crocus Dr
- 3007 W Redfield Rd
- 3017 W Hearn Rd
- 3743 W Dailey St
- 13816 N 34th Ave
- 13810 N 34th Ave
- 13824 N 34th Ave Unit 3
- 3415 W Calavar Rd
- 3416 W Thunderbird Rd
- 13830 N 34th Ave
- 13802 N 34th Ave
- 13815 N 34th Ave
- 13809 N 34th Ave
- 13823 N 34th Ave Unit 3
- 3421 W Calavar Rd
- 3422 W Thunderbird Rd
- 13801 N 34th Ave
- 13836 N 34th Ave
- 13829 N 34th Ave
- 3414 W Calavar Rd
- 3428 W Thunderbird Rd
- 3427 W Calavar Rd
- 13816 N 33rd Dr
- 13820 N 33rd Dr