
Landlord's Agent in 2019
Garrett Lickliter
Lickliter Realty Services LLC
(317) 358-5575
3 in this area
44 Total Sales
Estimated Value: $300,000 - $313,000
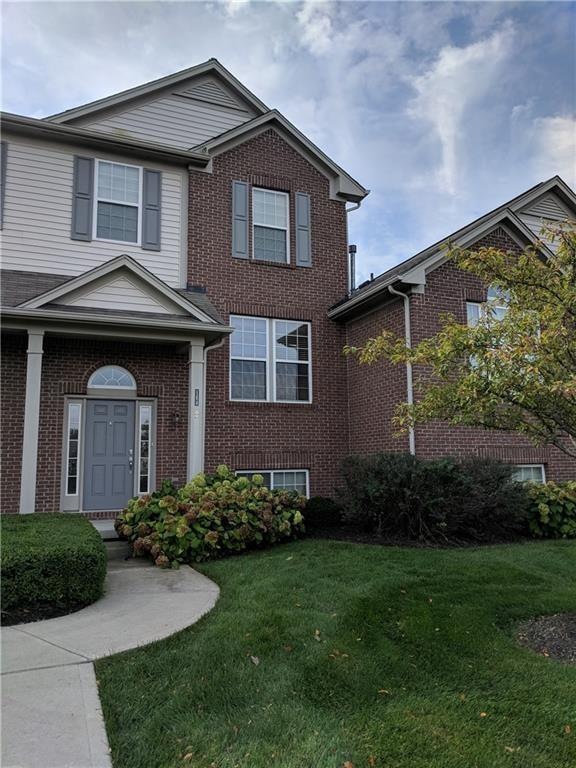
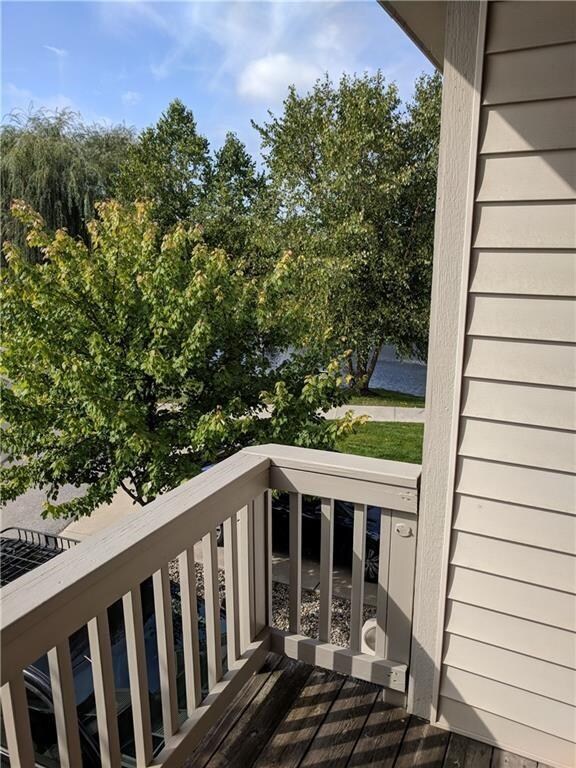
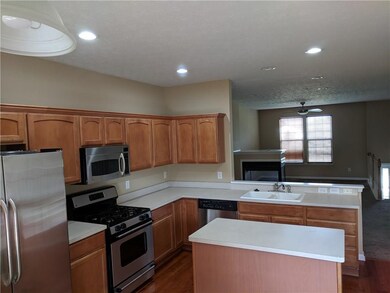
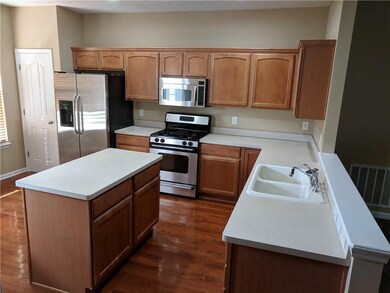
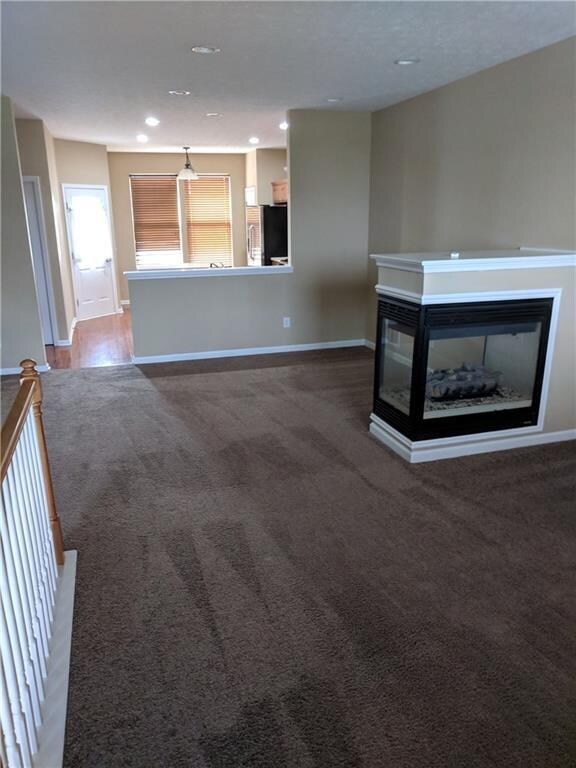
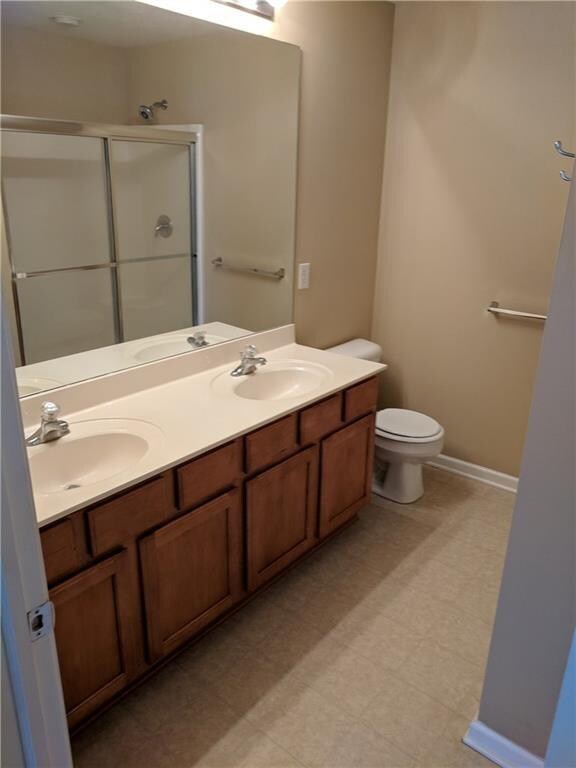
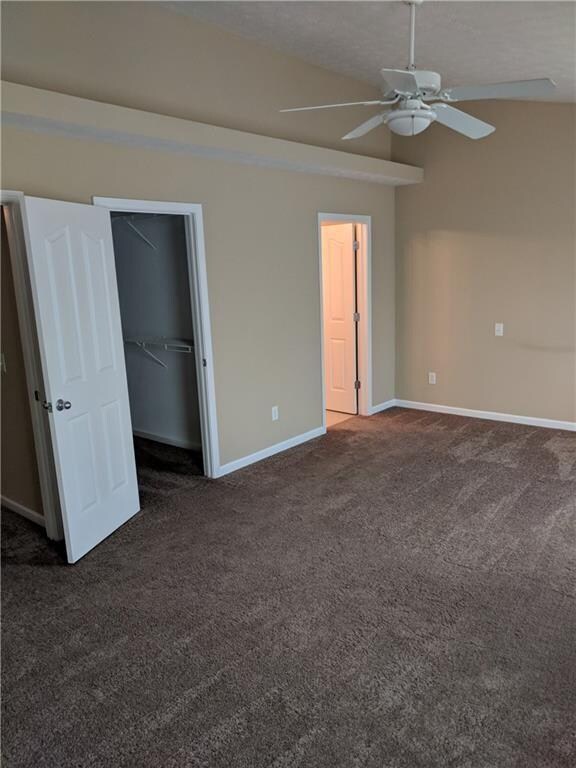
We have a great townhouse in a great location for rent! Open main level floor plan and main level balcony off back makes a great space for entertaining guests! Master suite with huge bathroom and walk in closet. attached two car garage in lower level. 3 large bedrooms on second floor and 2.5 bathrooms offers spacious living. Laundry included on main level. Bonus room/office/man-cave in the lower level. mudroom area at entry of garage. This is the perfect opportunity to rent in a wonderful community!
Last Agent to Rent the Property
Lickliter Realty Services LLC License #RB14051483 Listed on: 10/14/2019
Last Renter's Agent
Lickliter Realty Services LLC License #RB14051483 Listed on: 10/14/2019
| Date | Buyer | Sale Price | Title Company |
|---|---|---|---|
| Quallen Christopher D | -- | -- |
| Date | Status | Borrower | Loan Amount |
|---|---|---|---|
| Open | Quallen Christopher D | $128,940 | |
| Closed | Quallen Christopher D | $24,176 |
| Date | Event | Price | List to Sale | Price per Sq Ft |
|---|---|---|---|---|
| 11/21/2019 11/21/19 | Rented | $1,495 | 0.0% | -- |
| 10/30/2019 10/30/19 | Price Changed | $1,495 | -3.2% | $1 / Sq Ft |
| 10/14/2019 10/14/19 | For Rent | $1,545 | +3.3% | -- |
| 10/25/2018 10/25/18 | Rented | $1,495 | 0.0% | -- |
| 10/02/2018 10/02/18 | For Rent | $1,495 | 0.0% | -- |
| 02/24/2016 02/24/16 | Rented | -- | -- | -- |
| 02/13/2016 02/13/16 | Under Contract | -- | -- | -- |
| 12/17/2015 12/17/15 | For Rent | $1,495 | -- | -- |
| Year | Tax Paid | Tax Assessment Tax Assessment Total Assessment is a certain percentage of the fair market value that is determined by local assessors to be the total taxable value of land and additions on the property. | Land | Improvement |
|---|---|---|---|---|
| 2024 | $5,292 | $261,000 | $33,600 | $227,400 |
| 2023 | $5,292 | $244,200 | $33,600 | $210,600 |
| 2022 | $4,830 | $215,900 | $33,600 | $182,300 |
| 2021 | $4,289 | $188,200 | $33,600 | $154,600 |
| 2020 | $4,066 | $175,800 | $33,600 | $142,200 |
| 2019 | $4,065 | $174,900 | $31,000 | $143,900 |
| 2018 | $3,823 | $164,400 | $31,000 | $133,400 |
| 2017 | $3,612 | $157,000 | $31,000 | $126,000 |
| 2016 | $3,516 | $153,700 | $31,000 | $122,700 |
| 2014 | $2,830 | $132,600 | $31,000 | $101,600 |
| 2013 | $2,830 | $127,500 | $31,000 | $96,500 |
Landlord's Agent in 2019
Garrett Lickliter
Lickliter Realty Services LLC
(317) 358-5575
3 in this area
44 Total Sales
I
Seller's Agent in 2016
Ivan Barratt
J
Buyer's Agent in 2016
Jennifer McLean
CENTURY 21 Scheetz
Source: MIBOR Broker Listing Cooperative®
MLS Number: MBR21674901
APN: 29-11-25-004-016.000-020
Disclaimer: Certain information contained herein is derived from information provided by parties other than Homes.com. All information provided is deemed reliable, but is not guaranteed to be accurate and should be independently verified.
![]() Based on information submitted to the MLS GRID. All data is obtained from various sources and may not have been verified by broker or MLS GRID. Supplied Open House Information is subject to change without notice. All information should be independently reviewed and verified for accuracy. Properties may or may not be listed by the office/agent presenting the information. Some IDX listings have been excluded from this website.
Based on information submitted to the MLS GRID. All data is obtained from various sources and may not have been verified by broker or MLS GRID. Supplied Open House Information is subject to change without notice. All information should be independently reviewed and verified for accuracy. Properties may or may not be listed by the office/agent presenting the information. Some IDX listings have been excluded from this website.