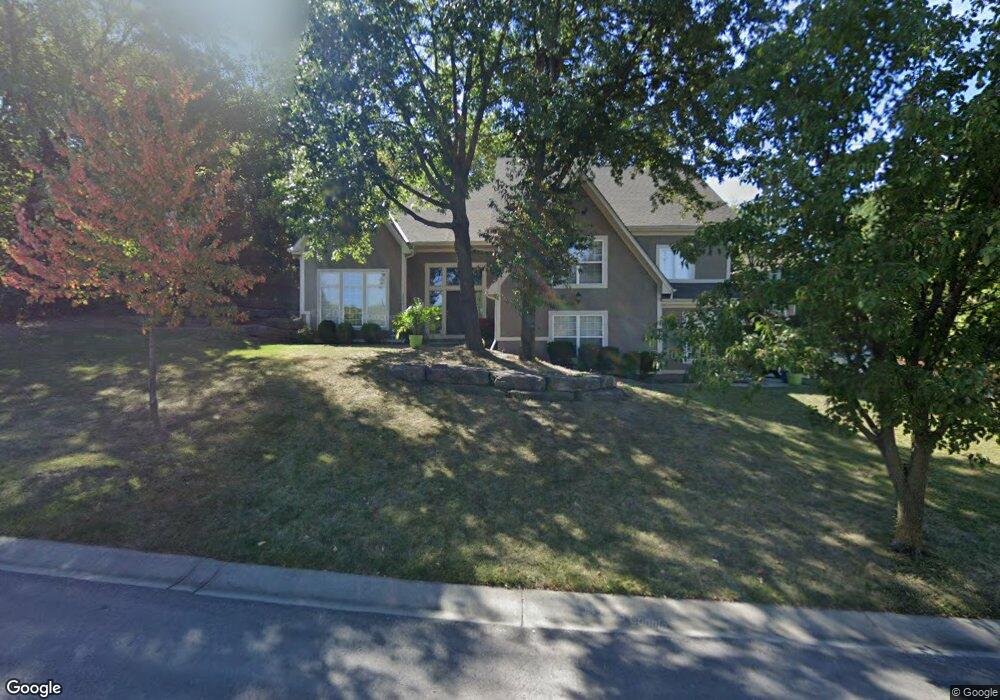
13861 W 57th St Shawnee, KS 66216
Estimated Value: $526,000 - $611,000
4
Beds
4
Baths
2,861
Sq Ft
$197/Sq Ft
Est. Value
About This Home
This home is located at 13861 W 57th St, Shawnee, KS 66216 and is currently estimated at $563,061, approximately $196 per square foot. 13861 W 57th St is a home located in Johnson County with nearby schools including Broken Arrow Elementary School, Trailridge Middle School, and Shawnee Mission Northwest High School.
Ownership History
Date
Name
Owned For
Owner Type
Purchase Details
Closed on
Dec 28, 2018
Sold by
Taitt Anson V and Taitt Living Trust
Bought by
Taitt Anson V
Current Estimated Value
Purchase Details
Closed on
Oct 25, 2018
Sold by
Taitt Sarah E and Taitt Anson V
Bought by
Taitt Anson V and Taitt Living Trust
Purchase Details
Closed on
Jan 10, 2013
Sold by
Traitt Anson V and Traitt Sarah E
Bought by
Taitt Anson and Taitt Sarah E
Purchase Details
Closed on
Sep 24, 2009
Sold by
Taitt Anson V and Taitt Sarah E
Bought by
Taitt Anson and Taitt Sarah E
Purchase Details
Closed on
Oct 25, 2007
Sold by
Earp Donald Clifton and Earp Caryl
Bought by
Taitt Anson and Taitt Sarah E
Home Financials for this Owner
Home Financials are based on the most recent Mortgage that was taken out on this home.
Original Mortgage
$246,050
Outstanding Balance
$155,598
Interest Rate
6.37%
Mortgage Type
New Conventional
Estimated Equity
$407,463
Create a Home Valuation Report for This Property
The Home Valuation Report is an in-depth analysis detailing your home's value as well as a comparison with similar homes in the area
Home Values in the Area
Average Home Value in this Area
Purchase History
| Date | Buyer | Sale Price | Title Company |
|---|---|---|---|
| Taitt Anson V | -- | None Available | |
| Taitt Anson V | -- | None Available | |
| Taitt Anson | -- | None Available | |
| Taitt Anson | -- | None Available | |
| Taitt Anson | -- | Kansas City Title |
Source: Public Records
Mortgage History
| Date | Status | Borrower | Loan Amount |
|---|---|---|---|
| Open | Taitt Anson | $246,050 |
Source: Public Records
Tax History Compared to Growth
Tax History
| Year | Tax Paid | Tax Assessment Tax Assessment Total Assessment is a certain percentage of the fair market value that is determined by local assessors to be the total taxable value of land and additions on the property. | Land | Improvement |
|---|---|---|---|---|
| 2024 | $5,668 | $53,245 | $10,855 | $42,390 |
| 2023 | $4,951 | $46,127 | $10,341 | $35,786 |
| 2022 | $4,925 | $45,724 | $10,341 | $35,383 |
| 2021 | $4,589 | $40,077 | $9,401 | $30,676 |
| 2020 | $4,325 | $37,272 | $8,585 | $28,687 |
| 2019 | $4,239 | $36,513 | $7,810 | $28,703 |
| 2018 | $4,176 | $35,834 | $7,810 | $28,024 |
| 2017 | $3,907 | $32,994 | $7,096 | $25,898 |
| 2016 | $3,855 | $32,143 | $7,096 | $25,047 |
| 2015 | $3,543 | $30,591 | $7,096 | $23,495 |
| 2013 | -- | $27,980 | $7,096 | $20,884 |
Source: Public Records
Map
Nearby Homes
- 5703 Cottonwood St
- 5713 Widmer Rd
- 5530 Rene St
- 5633 Oakview St
- 5502 Mullen Rd
- 5919 Pflumm Rd
- 5826 Oakview St
- 5507 Noland Rd
- 6143 Park St
- 6145 Park St
- 13810 W 53rd St
- 5807 Noland Rd
- 5300 Summit Ct
- 4908 Noland Rd
- 14204 W 63rd St
- 12809 W 57th Terrace
- 14214 W 63rd St
- 14210 W 50th St
- 12508 W 56th St
- 5021 Bradshaw St
- 13869 W 57th St
- 5712 Cottonwood St
- 13860 W 57th St
- 13864 W 57th St
- 5716 Cottonwood St
- 13870 W 57th Terrace
- 13856 W 57th St
- 13868 W 57th St
- 13874 W 57th Terrace
- 13866 W 57th Terrace
- 13852 W 57th St
- 13872 W 57th St
- 13878 W 57th Terrace
- 13862 W 57th Terrace
- 13876 W 57th St
- 5711 Cottonwood St
- 5707 Cottonwood St
- 5715 Cottonwood St
- 5719 Cottonwood St
- 13880 W 57th St