1389 S Bert Crane Rd Atwater, CA 95301
Estimated payment $26,722/month
About This Lot
Location
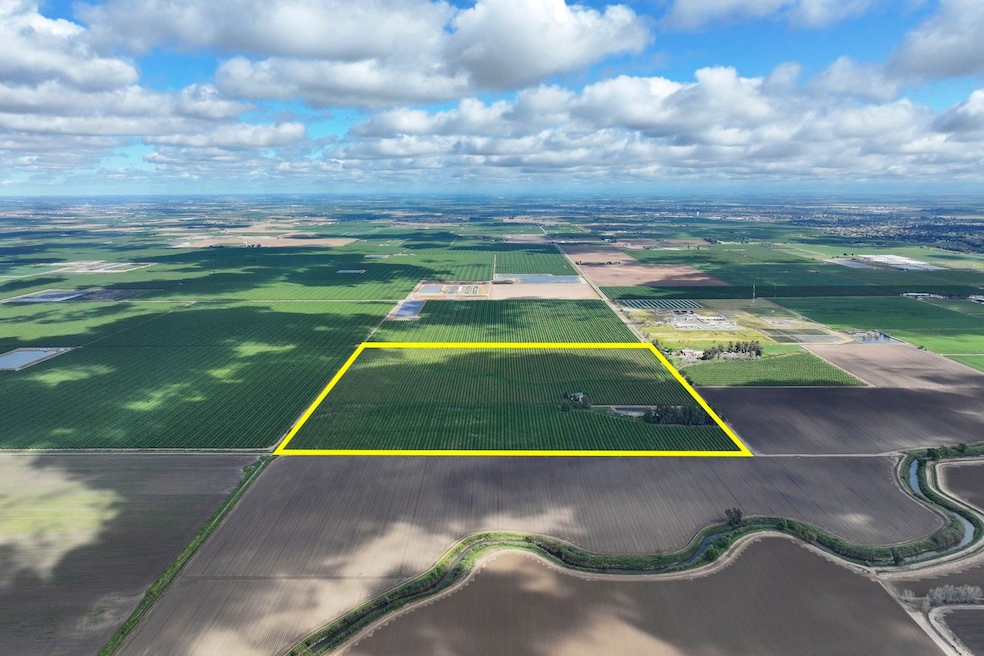
The property is located in the northwest corner of the curve on S. Bert Crane Road in Atwater, Merced County, CA.
Size
+/-154 Assessed Acres
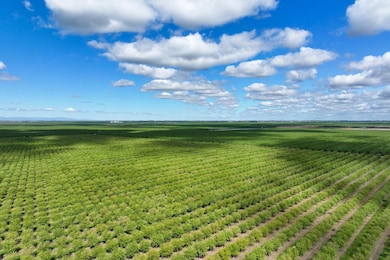
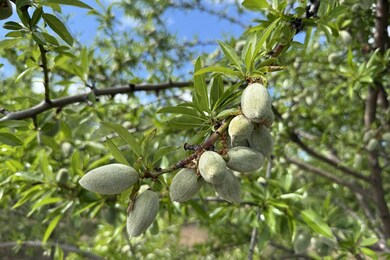
Plantings
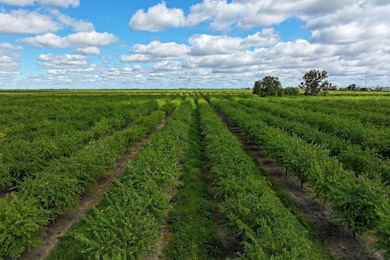
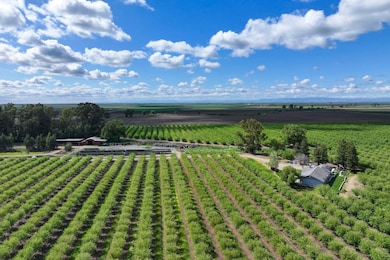
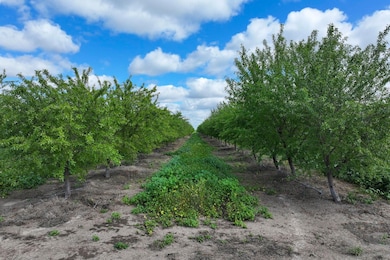
Property is planted to Nonpareil and Monterey Almonds on Hansen Rootstock. Trees were planted in 2019 at 22 x 14 spacing.
Home
The property features a 2,000 sq ft custom home, built in 1996, with an attached two-car garage.
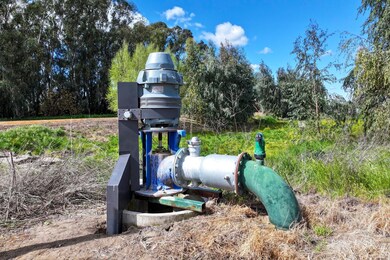
Water
Two (2) wells feed the reservoir, and a booster pump draws from the reservoir to irrigate the trees. Property is part of Merced Subbasin GSA.
Solar
There is solar on the property.
Soil
The property features both Grade 1 Excellent and Grade 2 Good soil. See Soil Map and Soil Description for details.
Legal
Merced County APN: 065-020-004
Groundwater Disclosure
Sustainable Groundwater Management Act (SGMA) requires groundwater basins to be sustainable by 2040. SGMA may limit ground water pumping. For more information, please visit the SGMA website.
The Buyer is responsible for conducting their own research to verify all information related to groundwater and surface water resources, including availability, usage rights, and potential restrictions.

Property Details
Property Type
- Land
Est. Annual Taxes
- $19,589
Map
Home Values in the Area
Average Home Value in this Area
Tax History
| Year | Tax Paid | Tax Assessment Tax Assessment Total Assessment is a certain percentage of the fair market value that is determined by local assessors to be the total taxable value of land and additions on the property. | Land | Improvement |
|---|---|---|---|---|
| 2025 | $19,589 | $1,856,901 | $881,246 | $975,655 |
| 2024 | $19,589 | $1,540,868 | $895,404 | $645,464 |
| 2023 | $19,314 | $1,521,742 | $888,934 | $632,808 |
| 2022 | $21,893 | $1,553,273 | $932,873 | $620,400 |
| 2021 | $17,566 | $1,539,716 | $931,480 | $608,236 |
| 2020 | $13,458 | $1,154,681 | $833,381 | $321,300 |
| 2019 | $6,516 | $581,189 | $322,941 | $258,248 |
| 2018 | $6,064 | $569,303 | $316,609 | $252,694 |
| 2017 | $5,939 | $553,754 | $310,402 | $243,352 |
| 2016 | $5,860 | $543,106 | $304,316 | $238,790 |
| 2015 | $5,783 | $534,804 | $299,746 | $235,058 |
| 2014 | $5,653 | $524,363 | $293,875 | $230,488 |
Property History
| Date | Event | Price | Change | Sq Ft Price |
|---|---|---|---|---|
| 05/27/2025 05/27/25 | Price Changed | $4,543,000 | 0.0% | -- |
| 05/27/2025 05/27/25 | For Sale | $4,543,000 | -7.8% | -- |
| 04/18/2025 04/18/25 | For Sale | $4,928,000 | +120.7% | -- |
| 04/24/2019 04/24/19 | Sold | $2,233,000 | -12.1% | $1,085 / Sq Ft |
| 01/24/2019 01/24/19 | Pending | -- | -- | -- |
| 01/13/2019 01/13/19 | For Sale | $2,541,000 | -- | $1,234 / Sq Ft |
Purchase History
| Date | Type | Sale Price | Title Company |
|---|---|---|---|
| Grant Deed | $4,928,000 | Fidelity National Title Co | |
| Grant Deed | $2,233,000 | Fidelity National Title Co | |
| Interfamily Deed Transfer | -- | None Available | |
| Interfamily Deed Transfer | -- | None Available |
Mortgage History
| Date | Status | Loan Amount | Loan Type |
|---|---|---|---|
| Open | $1,000,000 | Credit Line Revolving | |
| Closed | $2,440,000 | Commercial | |
| Closed | $0 | Credit Line Revolving |
- 0 Green Sands Ave Unit MC22098863
- 8808 State Highway 140
- 8808 California 140
- 1236 Hull Rd
- 5995 W Brooks Rd
- 1345 N Quinley Ave
- 1422 Stratford Ave
- 6231 Jake St
- 1021 Prince William Ct
- 1371 Shady Cove Ave
- 1071 Prince William Ct
- 1 White Crane Rd
- 0 White Crane Rd
- 5220 Queen Elizabeth Dr
- 1855 Gibbs Ave
- 5388 Moran Ave
- 6185 Shelby St
- 5261 Elliott Ave
- 2065 Atwater Blvd
- 1850 Grove Ave Unit 5
- 1670 Bellevue Rd Unit 2
- 1670 Bellevue Rd Unit 1
- 2300 Cascade Dr
- 2745 Muir Ave Unit 2745
- 1756 Willowbrook Dr
- 2908 Willowbrook Ct
- 1047-1065 W 19th St
- 953 W 18th St Unit 955
- 1226 Canal St
- 1205 Devonwood Dr
- 3640 Newport Ave
- 132 W 18th St
- 151 W 18th St
- 139 W 18th St
- 57 W 18th St Unit 57
- 55 W 18th St
- 53 W 18th St