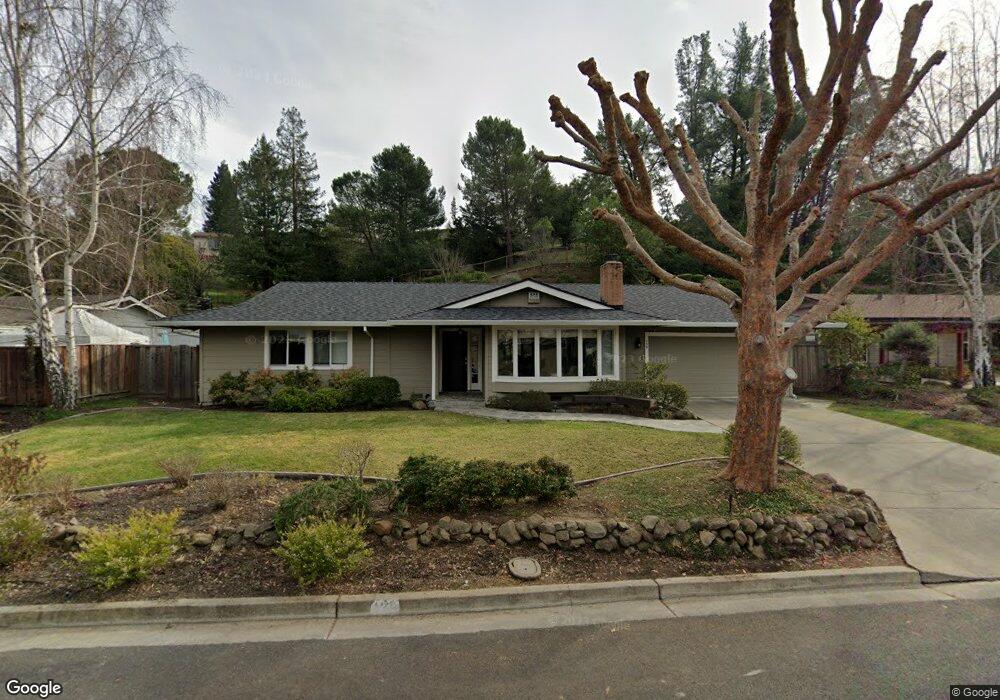
139 Shuey Dr Moraga, CA 94556
Estimated Value: $1,750,742 - $2,033,000
4
Beds
2
Baths
2,560
Sq Ft
$723/Sq Ft
Est. Value
About This Home
This home is located at 139 Shuey Dr, Moraga, CA 94556 and is currently estimated at $1,850,686, approximately $722 per square foot. 139 Shuey Dr is a home located in Contra Costa County with nearby schools including Camino Pablo Elementary School, Joaquin Moraga Intermediate School, and Campolindo High School.
Ownership History
Date
Name
Owned For
Owner Type
Purchase Details
Closed on
Nov 7, 2002
Sold by
Robertson James M and Robertson Valerie D
Bought by
Robertson James M and Robertson Valerie D
Current Estimated Value
Home Financials for this Owner
Home Financials are based on the most recent Mortgage that was taken out on this home.
Original Mortgage
$245,000
Interest Rate
5.95%
Mortgage Type
Purchase Money Mortgage
Purchase Details
Closed on
Apr 8, 1995
Sold by
Robertson James M and Robertson Valerie D
Bought by
Robertson James M and Robertson Valerie D
Purchase Details
Closed on
Nov 17, 1993
Sold by
Carvalho Stephen J and Carvalho Linda L
Bought by
Robertson James M and Robertson Valerie D
Home Financials for this Owner
Home Financials are based on the most recent Mortgage that was taken out on this home.
Original Mortgage
$253,000
Interest Rate
6.88%
Mortgage Type
Purchase Money Mortgage
Create a Home Valuation Report for This Property
The Home Valuation Report is an in-depth analysis detailing your home's value as well as a comparison with similar homes in the area
Purchase History
| Date | Buyer | Sale Price | Title Company |
|---|---|---|---|
| Robertson James M | -- | -- | |
| Robertson James M | -- | Fidelity National Title | |
| Robertson James M | -- | -- | |
| Robertson James M | $403,000 | Placer Title Company |
Source: Public Records
Mortgage History
| Date | Status | Borrower | Loan Amount |
|---|---|---|---|
| Closed | Robertson James M | $245,000 | |
| Closed | Robertson James M | $253,000 |
Source: Public Records
Tax History
| Year | Tax Paid | Tax Assessment Tax Assessment Total Assessment is a certain percentage of the fair market value that is determined by local assessors to be the total taxable value of land and additions on the property. | Land | Improvement |
|---|---|---|---|---|
| 2025 | $9,548 | $736,829 | $363,294 | $373,535 |
| 2024 | $9,319 | $722,382 | $356,171 | $366,211 |
| 2023 | $9,319 | $708,219 | $349,188 | $359,031 |
| 2022 | $9,177 | $694,334 | $342,342 | $351,992 |
| 2021 | $9,035 | $680,721 | $335,630 | $345,091 |
| 2019 | $8,878 | $660,532 | $325,676 | $334,856 |
| 2018 | $8,569 | $647,582 | $319,291 | $328,291 |
| 2017 | $8,428 | $634,885 | $313,031 | $321,854 |
| 2016 | $8,099 | $622,438 | $306,894 | $315,544 |
| 2015 | $8,024 | $613,090 | $302,285 | $310,805 |
| 2014 | $7,921 | $601,081 | $296,364 | $304,717 |
Source: Public Records
Map
Nearby Homes
- 30 Quail Crossing
- 1066 Larch Ave
- 1124 Sanders Dr
- 28 Harrington Rd
- 6 Sparrow Ct
- 19 Lance Ct
- 1020 Sanders Dr
- 34 Sherwood Ct
- 118 Merion Terrace
- 826 Augusta Dr
- 7 Doral Dr
- 31 Merrill Cir S
- 1585 Moraga Way Unit 11
- 769 Augusta Dr
- 4 Julianna Ct
- 201 Willowbrook Ln
- 923 Camino Ricardo
- 809 Villa Ln Unit 2
- 183 Miramonte Dr
- 314 Draeger Dr
Your Personal Tour Guide
Ask me questions while you tour the home.