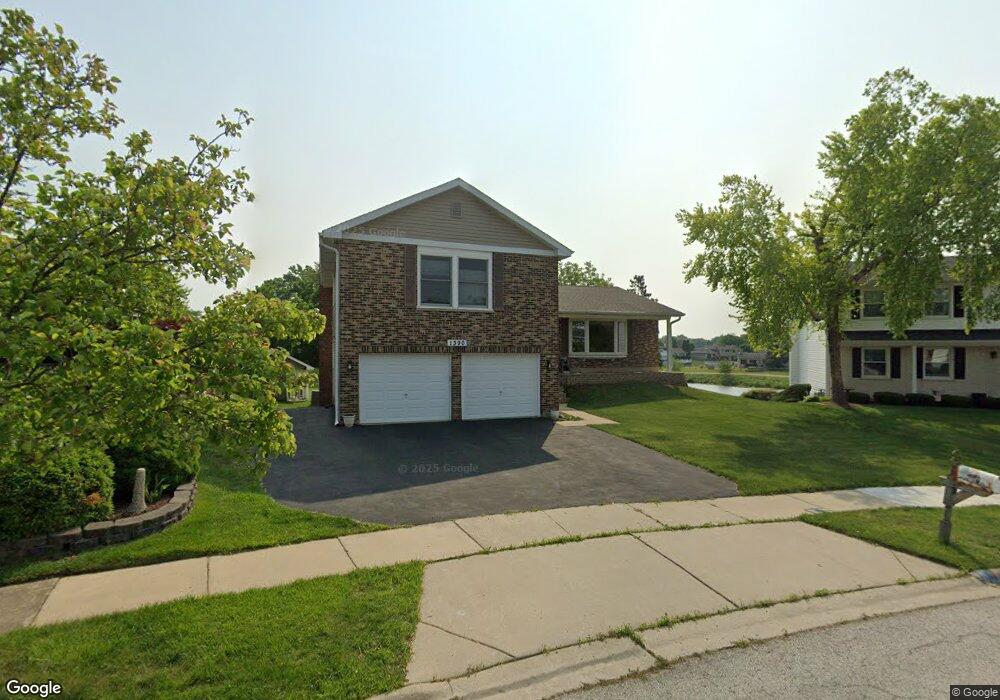
1390 Lake Edge Ct Hoffman Estates, IL 60192
South Ridge NeighborhoodEstimated Value: $497,000 - $596,000
4
Beds
3
Baths
2,395
Sq Ft
$226/Sq Ft
Est. Value
About This Home
This home is located at 1390 Lake Edge Ct, Hoffman Estates, IL 60192 and is currently estimated at $541,637, approximately $226 per square foot. 1390 Lake Edge Ct is a home located in Cook County with nearby schools including Frank C. Whiteley Elementary School, Plum Grove Jr High School, and William Fremd High School.
Ownership History
Date
Name
Owned For
Owner Type
Purchase Details
Closed on
Apr 26, 2021
Sold by
Kruse Scott and Kruse Judy M
Bought by
Kruse Scott T and Kruse Judy M
Current Estimated Value
Purchase Details
Closed on
Apr 28, 2005
Sold by
Schillin Clarence L and Schillin Bj
Bought by
Kruse Scott and Kruse Judy M
Home Financials for this Owner
Home Financials are based on the most recent Mortgage that was taken out on this home.
Original Mortgage
$258,000
Interest Rate
6.13%
Mortgage Type
Fannie Mae Freddie Mac
Purchase Details
Closed on
Jul 28, 1998
Sold by
Shillin Clarence L
Bought by
Shillin Clarence L and Shillin Bj
Purchase Details
Closed on
Aug 29, 1994
Sold by
Shillin Clarence L and Shillin Sandra L
Bought by
Shillin Clarence L
Home Financials for this Owner
Home Financials are based on the most recent Mortgage that was taken out on this home.
Original Mortgage
$119,000
Interest Rate
8.6%
Create a Home Valuation Report for This Property
The Home Valuation Report is an in-depth analysis detailing your home's value as well as a comparison with similar homes in the area
Home Values in the Area
Average Home Value in this Area
Purchase History
| Date | Buyer | Sale Price | Title Company |
|---|---|---|---|
| Kruse Scott T | -- | None Available | |
| Kruse Scott | $408,000 | Atg Search | |
| Shillin Clarence L | -- | Chicago Title Insurance Co | |
| Shillin Clarence L | -- | Republic Title Company |
Source: Public Records
Mortgage History
| Date | Status | Borrower | Loan Amount |
|---|---|---|---|
| Open | Kruse Scott | $150,000 | |
| Previous Owner | Kruse Scott | $258,000 | |
| Previous Owner | Shillin Clarence L | $119,000 |
Source: Public Records
Tax History Compared to Growth
Tax History
| Year | Tax Paid | Tax Assessment Tax Assessment Total Assessment is a certain percentage of the fair market value that is determined by local assessors to be the total taxable value of land and additions on the property. | Land | Improvement |
|---|---|---|---|---|
| 2024 | $10,296 | $34,454 | $6,911 | $27,543 |
| 2023 | $9,920 | $36,899 | $6,911 | $29,988 |
| 2022 | $9,920 | $36,899 | $6,911 | $29,988 |
| 2021 | $9,261 | $30,986 | $4,799 | $26,187 |
| 2020 | $9,132 | $30,986 | $4,799 | $26,187 |
| 2019 | $9,038 | $34,353 | $4,799 | $29,554 |
| 2018 | $10,122 | $35,384 | $4,415 | $30,969 |
| 2017 | $9,952 | $35,384 | $4,415 | $30,969 |
| 2016 | $9,490 | $35,384 | $4,415 | $30,969 |
| 2015 | $8,862 | $31,138 | $4,031 | $27,107 |
| 2014 | $8,712 | $31,138 | $4,031 | $27,107 |
| 2013 | $8,473 | $31,138 | $4,031 | $27,107 |
Source: Public Records
Map
Nearby Homes
- 4320 Lombardy Ln
- 1404 W Sapphire Dr
- 3925 Charlemagne Dr
- 4658 Burnham Dr
- 1195 Old Timber Ct
- 3960 Colony Ct
- 4797 Amber Cir
- 1208 Old Timber Ln
- 4760 Amber Cir
- 3991 Whispering Trails Dr
- 4827 Turnberry Dr
- 4090 N Parkside Dr
- 13 Chipping Campden Dr
- 3835 Huntington Blvd
- 330 Poteet Ave
- 26 Forest Ln
- 4850 Prestwick Place
- 4890 Prestwick Place
- 4944 Somerton Dr
- 16 Forest Ln
- 1400 Lake Edge Ct
- 1385 Lake Edge Ct
- 1410 Lake Edge Ct
- 1375 Nantucket Ct
- 1365 Nantucket Ct
- 1395 Lake Edge Ct
- 1425 Lake Edge Ct
- 1355 Nantucket Ct
- 1405 Lake Edge Ct
- 1385 Nantucket Ct
- 1415 Lake Edge Ct
- 1365 Fortune Bay Ct
- 1360 Nantucket Ct
- 1430 Lake Edge Ct
- 1375 Fortune Bay Ct
- 1355 Fortune Bay Ct
- 1405 W Stone Harbor Dr
- 1395 Nantucket Ct
- 1345 Fortune Bay Ct
- 4271 N Sturbridge Dr