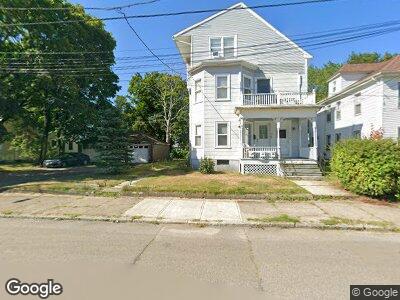
14 Angell St Attleboro, MA 02703
Estimated Value: $712,000 - $792,000
6
Beds
3
Baths
3,307
Sq Ft
$226/Sq Ft
Est. Value
About This Home
This home is located at 14 Angell St, Attleboro, MA 02703 and is currently estimated at $747,667, approximately $226 per square foot. 14 Angell St is a home located in Bristol County with nearby schools including Thomas E. Willett School, Cyril K. Brennan Middle School, and Attleboro High School.
Ownership History
Date
Name
Owned For
Owner Type
Purchase Details
Closed on
Mar 23, 2023
Sold by
Bumpus Gary M
Bought by
Bumpus Gary M and Bumpus Sheila J
Current Estimated Value
Home Financials for this Owner
Home Financials are based on the most recent Mortgage that was taken out on this home.
Original Mortgage
$810,000
Outstanding Balance
$809,651
Interest Rate
6.96%
Mortgage Type
Adjustable Rate Mortgage/ARM
Estimated Equity
-$103,651
Create a Home Valuation Report for This Property
The Home Valuation Report is an in-depth analysis detailing your home's value as well as a comparison with similar homes in the area
Home Values in the Area
Average Home Value in this Area
Purchase History
| Date | Buyer | Sale Price | Title Company |
|---|---|---|---|
| Bumpus Gary M | -- | None Available | |
| Bumpus Gary M | -- | None Available |
Source: Public Records
Mortgage History
| Date | Status | Borrower | Loan Amount |
|---|---|---|---|
| Open | Bumpus Gary M | $810,000 | |
| Closed | Bumpus Gary M | $810,000 | |
| Closed | Bumpus Gary M | $810,000 |
Source: Public Records
Tax History Compared to Growth
Tax History
| Year | Tax Paid | Tax Assessment Tax Assessment Total Assessment is a certain percentage of the fair market value that is determined by local assessors to be the total taxable value of land and additions on the property. | Land | Improvement |
|---|---|---|---|---|
| 2025 | $8,316 | $662,600 | $128,700 | $533,900 |
| 2024 | $8,006 | $628,900 | $128,700 | $500,200 |
| 2023 | $7,102 | $518,800 | $117,000 | $401,800 |
| 2022 | $6,475 | $448,100 | $111,400 | $336,700 |
| 2021 | $5,760 | $398,700 | $107,200 | $291,500 |
| 2020 | $5,521 | $379,200 | $104,100 | $275,100 |
| 2019 | $5,218 | $368,500 | $102,100 | $266,400 |
| 2018 | $4,247 | $323,000 | $99,100 | $223,900 |
| 2017 | $4,742 | $325,900 | $99,100 | $226,800 |
| 2016 | $4,009 | $270,500 | $97,300 | $173,200 |
| 2015 | $3,794 | $257,900 | $97,300 | $160,600 |
| 2014 | $3,536 | $238,100 | $92,600 | $145,500 |
Source: Public Records
Map
Nearby Homes