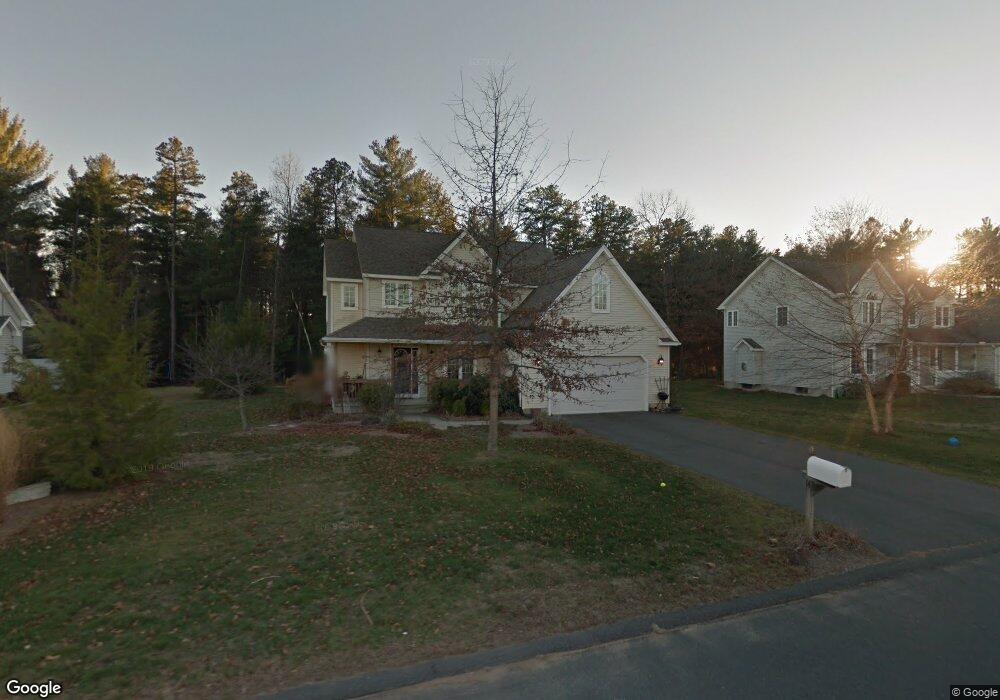
14 Willow Cir Easthampton, MA 01027
Estimated Value: $572,000 - $710,000
3
Beds
3
Baths
2,050
Sq Ft
$305/Sq Ft
Est. Value
About This Home
This home is located at 14 Willow Cir, Easthampton, MA 01027 and is currently estimated at $625,296, approximately $305 per square foot. 14 Willow Cir is a home located in Hampshire County with nearby schools including Easthampton High School, Calvary Baptist Christian School, and Tri-County Schools.
Ownership History
Date
Name
Owned For
Owner Type
Purchase Details
Closed on
Oct 17, 2014
Sold by
Jansen Margo P
Bought by
Jansen Alexander P
Current Estimated Value
Purchase Details
Closed on
Jun 4, 2010
Sold by
Lipman Ruthann I
Bought by
Jansen Alexander P G and Jansen Margo P T
Purchase Details
Closed on
Dec 14, 2007
Sold by
Summit Ridge Bldrs Inc
Bought by
Lipman Ruthann I
Home Financials for this Owner
Home Financials are based on the most recent Mortgage that was taken out on this home.
Original Mortgage
$357,325
Interest Rate
6.3%
Mortgage Type
Purchase Money Mortgage
Create a Home Valuation Report for This Property
The Home Valuation Report is an in-depth analysis detailing your home's value as well as a comparison with similar homes in the area
Home Values in the Area
Average Home Value in this Area
Purchase History
| Date | Buyer | Sale Price | Title Company |
|---|---|---|---|
| Jansen Alexander P | -- | -- | |
| Jansen Alexander P G | $346,000 | -- | |
| Lipman Ruthann I | $365,000 | -- |
Source: Public Records
Mortgage History
| Date | Status | Borrower | Loan Amount |
|---|---|---|---|
| Previous Owner | Lipman Ruthann I | $357,325 |
Source: Public Records
Tax History
| Year | Tax Paid | Tax Assessment Tax Assessment Total Assessment is a certain percentage of the fair market value that is determined by local assessors to be the total taxable value of land and additions on the property. | Land | Improvement |
|---|---|---|---|---|
| 2025 | $7,020 | $513,500 | $131,600 | $381,900 |
| 2024 | $6,795 | $501,100 | $127,800 | $373,300 |
| 2023 | $5,188 | $354,100 | $100,500 | $253,600 |
| 2022 | $5,853 | $354,100 | $100,500 | $253,600 |
| 2021 | $6,444 | $367,400 | $100,500 | $266,900 |
| 2020 | $6,289 | $354,100 | $100,500 | $253,600 |
| 2019 | $5,651 | $365,500 | $117,200 | $248,300 |
| 2018 | $5,442 | $340,100 | $110,400 | $229,700 |
| 2017 | $5,315 | $327,900 | $106,200 | $221,700 |
| 2016 | $5,112 | $327,900 | $106,200 | $221,700 |
| 2015 | $4,968 | $327,900 | $106,200 | $221,700 |
Source: Public Records
Map
Nearby Homes
Your Personal Tour Guide
Ask me questions while you tour the home.