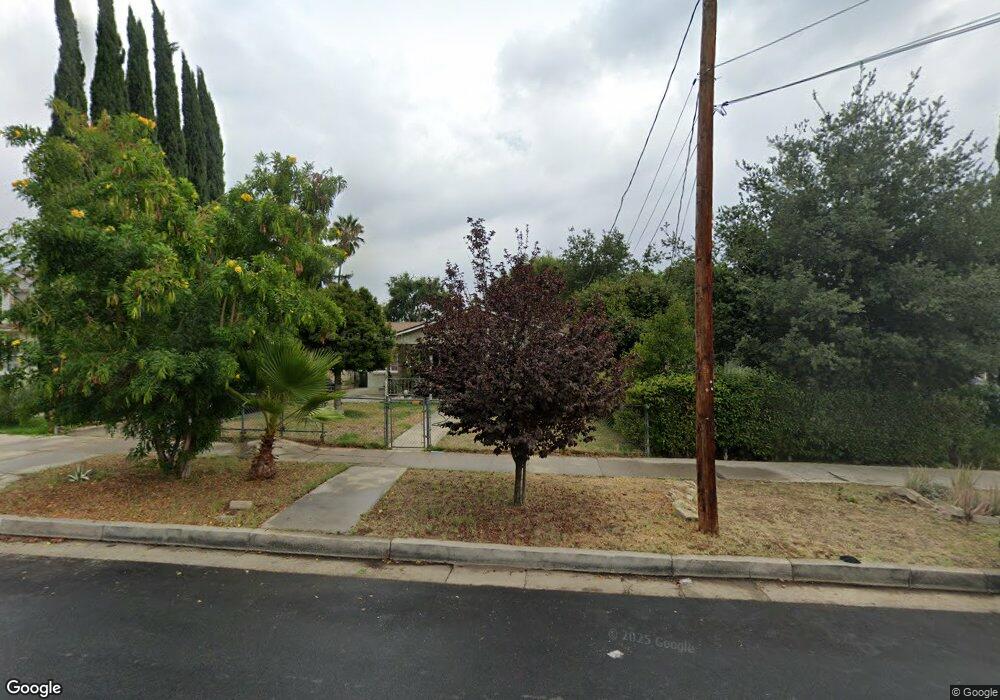
14086 Sayre St Sylmar, CA 91342
Estimated Value: $589,000 - $797,000
2
Beds
1
Bath
1,078
Sq Ft
$634/Sq Ft
Est. Value
About This Home
This home is located at 14086 Sayre St, Sylmar, CA 91342 and is currently estimated at $683,758, approximately $634 per square foot. 14086 Sayre St is a home located in Los Angeles County with nearby schools including Gridley Street Elementary School, Olive Vista Middle School, and San Fernando Senior High School.
Ownership History
Date
Name
Owned For
Owner Type
Purchase Details
Closed on
Nov 22, 2012
Sold by
Guzman Jose G
Bought by
Guzman Jose G and Guzman Patricia G
Current Estimated Value
Home Financials for this Owner
Home Financials are based on the most recent Mortgage that was taken out on this home.
Original Mortgage
$76,995
Outstanding Balance
$13,628
Interest Rate
3.33%
Mortgage Type
New Conventional
Estimated Equity
$670,130
Purchase Details
Closed on
Feb 15, 1999
Sold by
Hud
Bought by
Guzman Jose G
Home Financials for this Owner
Home Financials are based on the most recent Mortgage that was taken out on this home.
Original Mortgage
$106,400
Interest Rate
6.78%
Purchase Details
Closed on
Dec 19, 1997
Sold by
Norwest Mtg Inc
Bought by
Hud
Purchase Details
Closed on
Jul 23, 1997
Sold by
Lopez Rafael
Bought by
Norwest Mtg Inc
Purchase Details
Closed on
Sep 7, 1996
Sold by
Lopez Rafael
Bought by
Lopez Rafael and Lopez Maria D
Create a Home Valuation Report for This Property
The Home Valuation Report is an in-depth analysis detailing your home's value as well as a comparison with similar homes in the area
Home Values in the Area
Average Home Value in this Area
Purchase History
| Date | Buyer | Sale Price | Title Company |
|---|---|---|---|
| Guzman Jose G | -- | Lsi Title Company | |
| Guzman Jose G | $112,000 | -- | |
| Hud | -- | Fidelity National Title Ins | |
| Norwest Mtg Inc | $141,143 | Fidelity National Title Ins | |
| Lopez Rafael | -- | -- |
Source: Public Records
Mortgage History
| Date | Status | Borrower | Loan Amount |
|---|---|---|---|
| Open | Guzman Jose G | $76,995 | |
| Closed | Guzman Jose G | $106,400 |
Source: Public Records
Tax History
| Year | Tax Paid | Tax Assessment Tax Assessment Total Assessment is a certain percentage of the fair market value that is determined by local assessors to be the total taxable value of land and additions on the property. | Land | Improvement |
|---|---|---|---|---|
| 2025 | $2,324 | $175,553 | $73,666 | $101,887 |
| 2024 | $2,324 | $172,112 | $72,222 | $99,890 |
| 2023 | $2,283 | $168,738 | $70,806 | $97,932 |
| 2022 | $2,182 | $165,430 | $69,418 | $96,012 |
| 2021 | $2,152 | $162,187 | $68,057 | $94,130 |
| 2019 | $2,091 | $157,379 | $66,040 | $91,339 |
| 2018 | $2,003 | $154,295 | $64,746 | $89,549 |
| 2016 | $1,905 | $148,306 | $62,233 | $86,073 |
| 2015 | $1,879 | $146,080 | $61,299 | $84,781 |
| 2014 | $1,895 | $143,220 | $60,099 | $83,121 |
Source: Public Records
Map
Nearby Homes
- 12901 Borden Ave
- 14052 Aztec St
- 13025 Dronfield Ave
- 13040 Dronfield Ave Unit 12
- 13040 Dronfield Ave Unit 3
- 13040 Dronfield Ave Unit 25
- 13050 Dronfield Ave Unit 21
- 13050 Dronfield Ave
- 13080 Dronfield Ave Unit 80
- 13100 Bromont Ave Unit 11
- 13100 Bromont Ave Unit 15
- 13100 Bromont Ave Unit 46
- 1926 Lucas St Unit 2
- 13144 Bromont Ave Unit 3
- 13144 Bromont Ave
- 655 N Meyer St
- 12446 Herrick Ave
- 1929 Glenoaks Blvd Unit 122
- 1921 Glenoaks Blvd Unit 196
- 14529 Paddock St
- 14100 Sayre St
- 14082 Sayre St
- 14076 Sayre St
- 14106 Sayre St
- 14057 Herron St
- 14072 Sayre St
- 14110 Sayre St
- 14053 Herron St
- 14061 Herron St
- 14067 Herron St
- 14116 Sayre St
- 14085 Sayre St
- 14043 Herron St
- 14101 Sayre St
- 14073 Herron St
- 14081 Sayre St
- 14105 Sayre St
- 12917 Borden Ave
- 14075 Sayre St
- 12911 Borden Ave
Your Personal Tour Guide
Ask me questions while you tour the home.