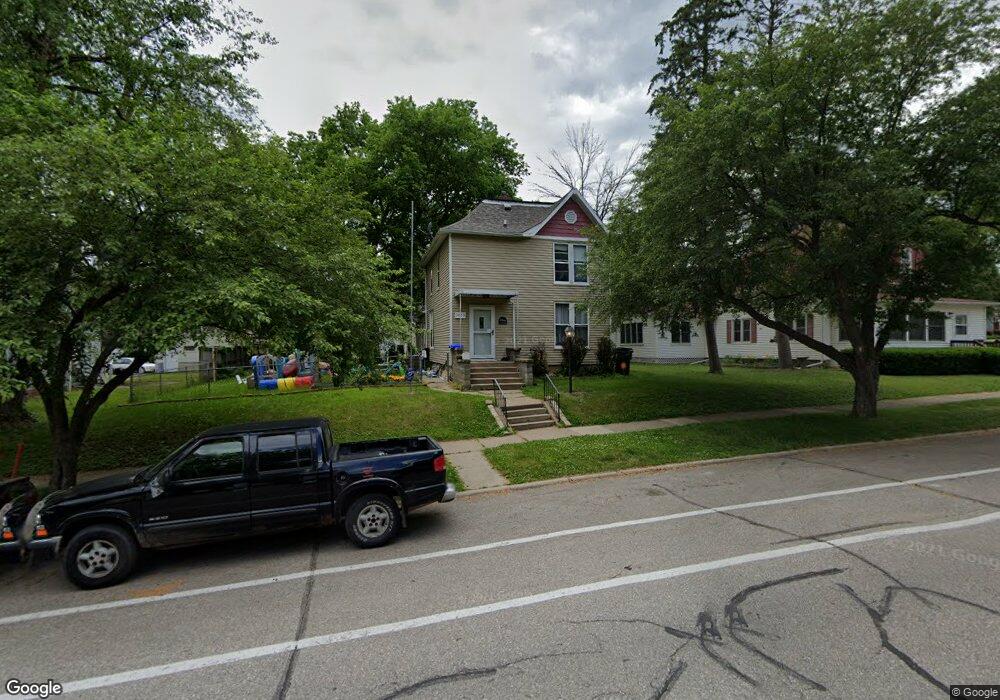
1409 Clay St Cedar Falls, IA 50613
Estimated Value: $175,000 - $195,000
3
Beds
1
Bath
1,312
Sq Ft
$140/Sq Ft
Est. Value
About This Home
This home is located at 1409 Clay St, Cedar Falls, IA 50613 and is currently estimated at $183,504, approximately $139 per square foot. 1409 Clay St is a home located in Black Hawk County with nearby schools including Lincoln Elementary School, Holmes Junior High School, and Cedar Falls High School.
Ownership History
Date
Name
Owned For
Owner Type
Purchase Details
Closed on
Sep 21, 2010
Sold by
Davis Shirley A and Davis Arthur L
Bought by
Sevcik Joseph R and Sevcik Lisa A
Current Estimated Value
Purchase Details
Closed on
May 24, 2006
Sold by
Davis Arthur L and Davis Shirley A
Bought by
Hearn Larry and Hearn Michele
Purchase Details
Closed on
May 18, 2006
Sold by
Trotter Lori L
Bought by
Davis Arthur L and Davis Shirley
Create a Home Valuation Report for This Property
The Home Valuation Report is an in-depth analysis detailing your home's value as well as a comparison with similar homes in the area
Home Values in the Area
Average Home Value in this Area
Purchase History
| Date | Buyer | Sale Price | Title Company |
|---|---|---|---|
| Sevcik Joseph R | $104,500 | None Available | |
| Hearn Larry | $100,000 | None Available | |
| Davis Arthur L | $100,000 | None Available |
Source: Public Records
Tax History Compared to Growth
Tax History
| Year | Tax Paid | Tax Assessment Tax Assessment Total Assessment is a certain percentage of the fair market value that is determined by local assessors to be the total taxable value of land and additions on the property. | Land | Improvement |
|---|---|---|---|---|
| 2025 | $2,474 | $177,640 | $45,280 | $132,360 |
| 2024 | $2,474 | $153,750 | $29,110 | $124,640 |
| 2023 | $2,472 | $153,750 | $29,110 | $124,640 |
| 2022 | $2,502 | $133,930 | $29,110 | $104,820 |
| 2021 | $2,344 | $133,930 | $29,110 | $104,820 |
| 2020 | $2,296 | $125,840 | $21,020 | $104,820 |
| 2019 | $2,296 | $125,840 | $21,020 | $104,820 |
| 2018 | $2,276 | $123,180 | $21,020 | $102,160 |
| 2017 | $2,326 | $123,180 | $21,020 | $102,160 |
| 2016 | $2,176 | $123,180 | $21,020 | $102,160 |
| 2015 | $2,176 | $123,180 | $21,020 | $102,160 |
| 2014 | $1,964 | $109,850 | $21,020 | $88,830 |
Source: Public Records
Map
Nearby Homes