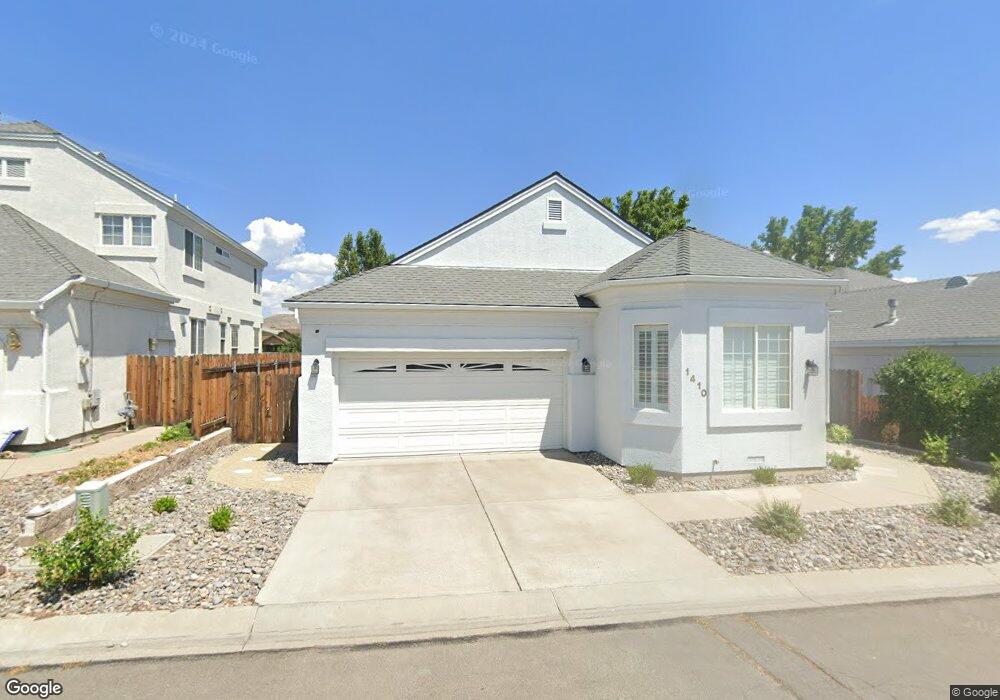
1410 Alberta Ct Carson City, NV 89703
Lakeview NeighborhoodEstimated Value: $502,150 - $544,000
2
Beds
2
Baths
1,381
Sq Ft
$377/Sq Ft
Est. Value
About This Home
This home is located at 1410 Alberta Ct, Carson City, NV 89703 and is currently estimated at $521,038, approximately $377 per square foot. 1410 Alberta Ct is a home located in Carson City with nearby schools including Fritsch Elementary School, Carson Middle School, and Carson High School.
Ownership History
Date
Name
Owned For
Owner Type
Purchase Details
Closed on
Jul 18, 2007
Sold by
Cartus Financial Corp
Bought by
Falk Cher
Current Estimated Value
Home Financials for this Owner
Home Financials are based on the most recent Mortgage that was taken out on this home.
Original Mortgage
$75,000
Interest Rate
6.05%
Mortgage Type
Purchase Money Mortgage
Purchase Details
Closed on
Jun 12, 2007
Sold by
Meyer Hans Jorg and Meyer Renee
Bought by
Cartus Financial Corp
Home Financials for this Owner
Home Financials are based on the most recent Mortgage that was taken out on this home.
Original Mortgage
$75,000
Interest Rate
6.05%
Mortgage Type
Purchase Money Mortgage
Purchase Details
Closed on
Jun 27, 2005
Sold by
Denton David L and Denton Susan F
Bought by
Meyer Renee D and Meyer Hans Jorg
Home Financials for this Owner
Home Financials are based on the most recent Mortgage that was taken out on this home.
Original Mortgage
$315,000
Interest Rate
5.51%
Mortgage Type
New Conventional
Create a Home Valuation Report for This Property
The Home Valuation Report is an in-depth analysis detailing your home's value as well as a comparison with similar homes in the area
Home Values in the Area
Average Home Value in this Area
Purchase History
| Date | Buyer | Sale Price | Title Company |
|---|---|---|---|
| Falk Cher | $337,500 | First American Title Reno | |
| Cartus Financial Corp | $370,000 | First American Title Ins Co | |
| Meyer Renee D | $350,000 | First American Title Co Nv |
Source: Public Records
Mortgage History
| Date | Status | Borrower | Loan Amount |
|---|---|---|---|
| Previous Owner | Falk Cher | $75,000 | |
| Previous Owner | Meyer Renee D | $315,000 |
Source: Public Records
Tax History Compared to Growth
Tax History
| Year | Tax Paid | Tax Assessment Tax Assessment Total Assessment is a certain percentage of the fair market value that is determined by local assessors to be the total taxable value of land and additions on the property. | Land | Improvement |
|---|---|---|---|---|
| 2025 | $2,800 | $106,028 | $36,750 | $69,278 |
| 2024 | $2,718 | $107,274 | $36,750 | $70,524 |
| 2023 | $2,634 | $102,447 | $36,225 | $66,222 |
| 2022 | $2,558 | $92,961 | $32,900 | $60,061 |
| 2021 | $2,483 | $88,964 | $29,925 | $59,039 |
| 2020 | $2,483 | $85,046 | $26,775 | $58,271 |
| 2019 | $2,339 | $84,483 | $26,775 | $57,708 |
| 2018 | $2,271 | $82,541 | $26,775 | $55,766 |
| 2017 | $2,205 | $81,114 | $25,550 | $55,564 |
| 2016 | $2,150 | $82,550 | $25,550 | $57,000 |
| 2015 | $2,146 | $82,404 | $25,410 | $56,994 |
| 2014 | $2,083 | $72,160 | $21,175 | $50,985 |
Source: Public Records
Map
Nearby Homes
- 1451 Alberta Ct
- 2437 Chardonnay Dr
- 2937 Gentile Ct
- 1239 Flintwood Dr
- 2511 Simons Ct
- 1559 Robb Dr
- 2804 Oak Ridge Dr
- 1636 Robb Dr
- 2547 Christmas Tree Dr
- 1112 Drysdale Ct
- 1010 W Winnie Ln
- 2340 Christmas Tree Dr
- 3277 Dartmouth Ct
- 1640 Chaparral Dr
- 3384 Harvard Dr
- 1051 Chaparral Dr
- 613 Ivy St
- 3612 Red Leaf Dr
- 601 Ivy St
- 1777 N Winnie Ln
- 1428 Alberta Ct
- 1392 Alberta Ct
- 1446 Alberta Ct
- 1415 Alberta Ct
- 1374 Alberta Ct
- 1397 Alberta Ct
- 1356 Alberta Ct
- 1469 Alberta Ct
- 1432 Flintwood Dr
- 1379 Alberta Ct
- 1482 Alberta Ct
- 1338 Alberta Ct
- 1487 Alberta Ct
- 1361 Alberta Ct
- 1464 Flintwood Dr
- 1416 Flintwood Dr
- 1500 Evergreen Dr
- 1343 Alberta Ct
- 1400 Flintwood Dr
- 1480 Flintwood Dr