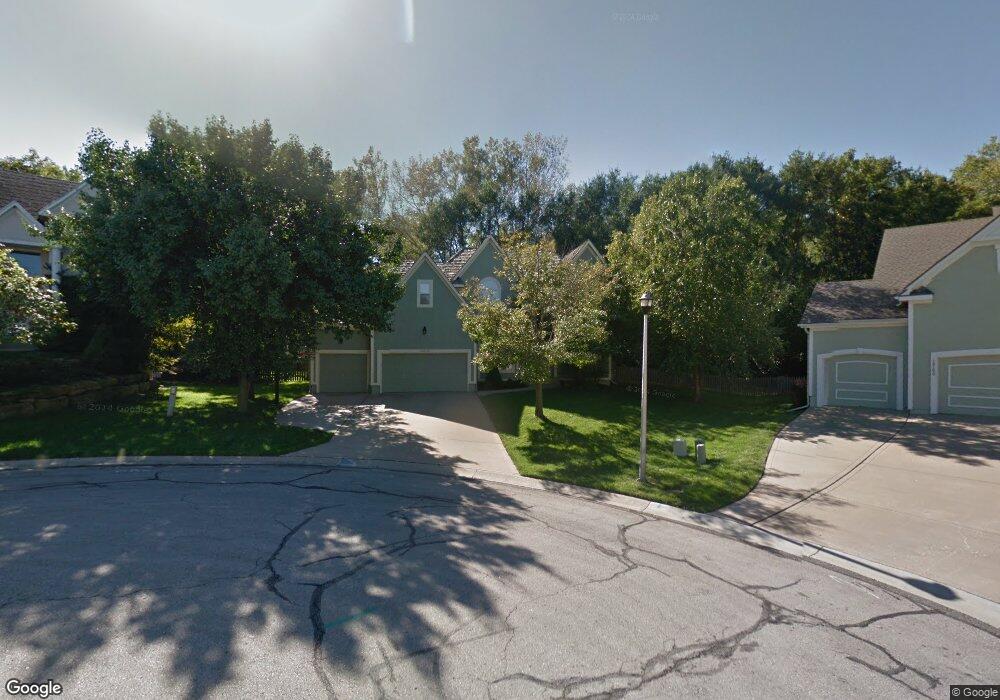
14105 W 58th Place Shawnee, KS 66216
Estimated Value: $517,000 - $569,000
4
Beds
4
Baths
2,614
Sq Ft
$204/Sq Ft
Est. Value
About This Home
This home is located at 14105 W 58th Place, Shawnee, KS 66216 and is currently estimated at $534,191, approximately $204 per square foot. 14105 W 58th Place is a home located in Johnson County with nearby schools including Broken Arrow Elementary School, Trailridge Middle School, and Shawnee Mission Northwest High School.
Ownership History
Date
Name
Owned For
Owner Type
Purchase Details
Closed on
Jul 9, 2014
Sold by
Yunger John Casey and Yunger Melanie L
Bought by
The John Casey Yunger And Melanie L Yung and Yunger Melanie L
Current Estimated Value
Purchase Details
Closed on
Feb 1, 2013
Sold by
Yunger John Casey and Yunger Melanie L
Bought by
Yunger John C and Yunger Melanie L
Home Financials for this Owner
Home Financials are based on the most recent Mortgage that was taken out on this home.
Original Mortgage
$240,000
Outstanding Balance
$167,540
Interest Rate
3.38%
Mortgage Type
New Conventional
Estimated Equity
$366,651
Purchase Details
Closed on
Dec 30, 2003
Sold by
Rollins Danny Lee and Chandler Monica
Bought by
Nelson Steven D and Nelson Emma P
Home Financials for this Owner
Home Financials are based on the most recent Mortgage that was taken out on this home.
Original Mortgage
$208,000
Interest Rate
5.84%
Mortgage Type
Purchase Money Mortgage
Create a Home Valuation Report for This Property
The Home Valuation Report is an in-depth analysis detailing your home's value as well as a comparison with similar homes in the area
Home Values in the Area
Average Home Value in this Area
Purchase History
| Date | Buyer | Sale Price | Title Company |
|---|---|---|---|
| The John Casey Yunger And Melanie L Yung | -- | None Available | |
| Yunger John C | -- | Platinum Title Llc | |
| Nelson Steven D | -- | Security Land Title Company |
Source: Public Records
Mortgage History
| Date | Status | Borrower | Loan Amount |
|---|---|---|---|
| Open | Yunger John C | $240,000 | |
| Closed | Nelson Steven D | $208,000 |
Source: Public Records
Tax History Compared to Growth
Tax History
| Year | Tax Paid | Tax Assessment Tax Assessment Total Assessment is a certain percentage of the fair market value that is determined by local assessors to be the total taxable value of land and additions on the property. | Land | Improvement |
|---|---|---|---|---|
| 2024 | $5,664 | $53,210 | $11,480 | $41,730 |
| 2023 | $5,122 | $47,714 | $10,937 | $36,777 |
| 2022 | $4,784 | $44,414 | $10,937 | $33,477 |
| 2021 | $4,783 | $41,779 | $9,939 | $31,840 |
| 2020 | $4,589 | $39,560 | $9,075 | $30,485 |
| 2019 | $4,444 | $38,284 | $8,256 | $30,028 |
| 2018 | $4,460 | $38,284 | $8,256 | $30,028 |
| 2017 | $4,374 | $36,961 | $7,497 | $29,464 |
| 2016 | $4,416 | $36,846 | $7,497 | $29,349 |
| 2015 | $4,087 | $35,271 | $7,497 | $27,774 |
| 2013 | -- | $33,914 | $7,497 | $26,417 |
Source: Public Records
Map
Nearby Homes
- 5826 Oakview St
- 5713 Widmer Rd
- 5633 Oakview St
- 5703 Cottonwood St
- 5502 Mullen Rd
- 5530 Rene St
- 6143 Park St
- 6145 Park St
- 14214 W 63rd St
- 14204 W 63rd St
- 5919 Pflumm Rd
- 5507 Noland Rd
- 5807 Noland Rd
- 4908 Noland Rd
- 14406 W 65th Terrace
- 13810 W 53rd St
- 5300 Summit Ct
- 12809 W 57th Terrace
- 13415 W 66th Terrace
- 6640 Pflumm Rd
- 14101 W 58th Place
- 14102 W 58th Place
- 5825 Mullen Rd
- 5829 Mullen Rd
- 5821 Mullen Rd
- 14007 W 58th Place
- 14008 W 58th Place
- 14311 W 58th Terrace
- 14319 W 58th Terrace
- 14004 W 58th Place
- 14307 W 58th Terrace
- 5824 Mullen Rd
- 5828 Mullen Rd
- 5842 Widmer Rd
- 14303 W 58th Terrace
- 5820 Mullen Rd
- 13910 W 58th Place
- 5836 Widmer Rd
- 5916 Albervan St
- 14405 W 58th Terrace