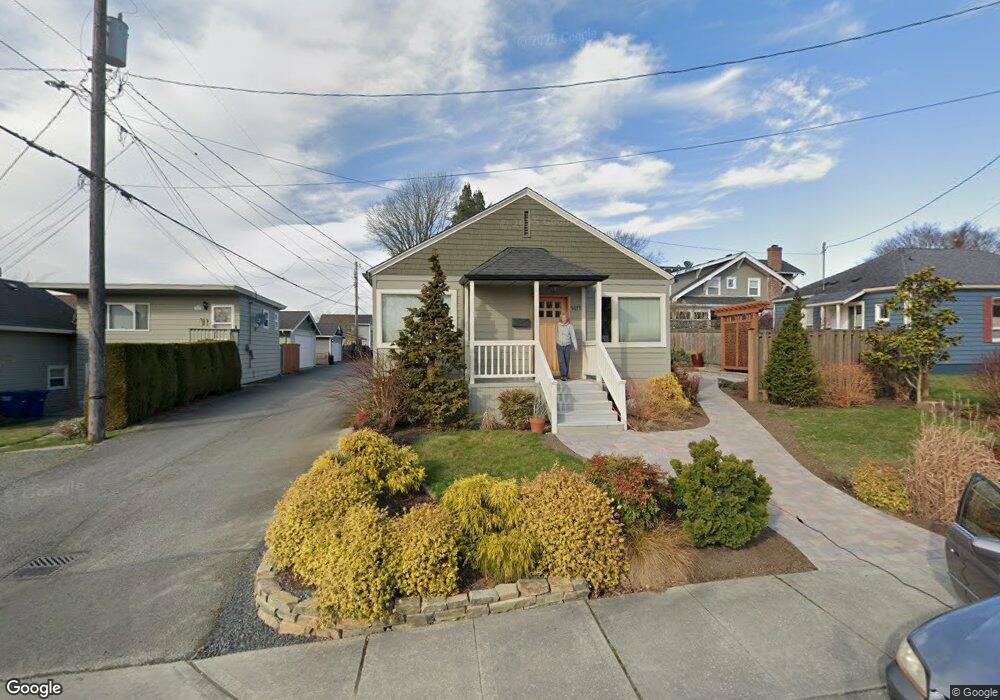
1411 11th St Everett, WA 98201
Northwest Everett NeighborhoodEstimated Value: $465,000 - $546,000
2
Beds
2
Baths
850
Sq Ft
$590/Sq Ft
Est. Value
About This Home
This home is located at 1411 11th St, Everett, WA 98201 and is currently estimated at $501,432, approximately $589 per square foot. 1411 11th St is a home located in Snohomish County with nearby schools including Whittier Elementary School, North Middle School, and Everett High School.
Ownership History
Date
Name
Owned For
Owner Type
Purchase Details
Closed on
Feb 11, 2008
Sold by
Meehan Michael K and Meehan Rebecca A
Bought by
Meier Cheryl A
Current Estimated Value
Home Financials for this Owner
Home Financials are based on the most recent Mortgage that was taken out on this home.
Original Mortgage
$122,500
Interest Rate
6.04%
Mortgage Type
Purchase Money Mortgage
Purchase Details
Closed on
Feb 27, 2001
Sold by
Meehan Michael K
Bought by
Meehan Michael K and Meehan Rebecca A
Home Financials for this Owner
Home Financials are based on the most recent Mortgage that was taken out on this home.
Original Mortgage
$68,600
Interest Rate
6.6%
Purchase Details
Closed on
Oct 6, 1997
Sold by
Bearce Joel S
Bought by
Meehan Michael K
Home Financials for this Owner
Home Financials are based on the most recent Mortgage that was taken out on this home.
Original Mortgage
$70,000
Interest Rate
7.44%
Create a Home Valuation Report for This Property
The Home Valuation Report is an in-depth analysis detailing your home's value as well as a comparison with similar homes in the area
Home Values in the Area
Average Home Value in this Area
Purchase History
| Date | Buyer | Sale Price | Title Company |
|---|---|---|---|
| Meier Cheryl A | $220,000 | Stewart Title Of Snohomish C | |
| Meehan Michael K | -- | -- | |
| Meehan Michael K | $13,094 | Pacific Northwest Title |
Source: Public Records
Mortgage History
| Date | Status | Borrower | Loan Amount |
|---|---|---|---|
| Closed | Meier Cheryl A | $122,500 | |
| Previous Owner | Meehan Michael K | $68,600 | |
| Previous Owner | Meehan Michael K | $70,000 |
Source: Public Records
Tax History
| Year | Tax Paid | Tax Assessment Tax Assessment Total Assessment is a certain percentage of the fair market value that is determined by local assessors to be the total taxable value of land and additions on the property. | Land | Improvement |
|---|---|---|---|---|
| 2026 | $555 | $477,100 | $376,300 | $100,800 |
| 2025 | $551 | $437,800 | $341,800 | $96,000 |
| 2024 | $551 | $457,000 | $361,000 | $96,000 |
| 2023 | $1,065 | $530,900 | $412,800 | $118,100 |
| 2022 | $1,269 | $352,800 | $252,700 | $100,100 |
| 2020 | $3,663 | $326,300 | $221,000 | $105,300 |
| 2019 | $3,407 | $305,500 | $202,000 | $103,500 |
| 2018 | $3,289 | $270,300 | $178,000 | $92,300 |
| 2017 | $2,810 | $230,000 | $169,000 | $61,000 |
| 2016 | $2,436 | $209,600 | $151,000 | $58,600 |
| 2015 | $2,377 | $192,600 | $147,000 | $45,600 |
| 2013 | $2,058 | $147,200 | $107,000 | $40,200 |
Source: Public Records
Map
Nearby Homes
- 1018 Rucker Ave
- 1005 Grand Ave
- 1027 Wetmore Ave
- 2501 W Marine View Dr
- 1602 Rucker Ave
- 512 Wetmore Ave
- 416 Alverson Blvd
- 2311 Jade Ave
- 1216 N Broadway
- 3401 N Broadway
- 1523 Virginia Ave
- 1601 Virginia Ave
- 1721 Mcdougall Ave
- 2905 11th St Unit A
- 2905 11th St Unit B
- 2905 11th St Unit C & D
- 1621 Baker Ave
- 1925 Lombard Ave Unit A
- 1925 Lombard Ave Unit A,B,C
- 1920 Broadway
Your Personal Tour Guide
Ask me questions while you tour the home.