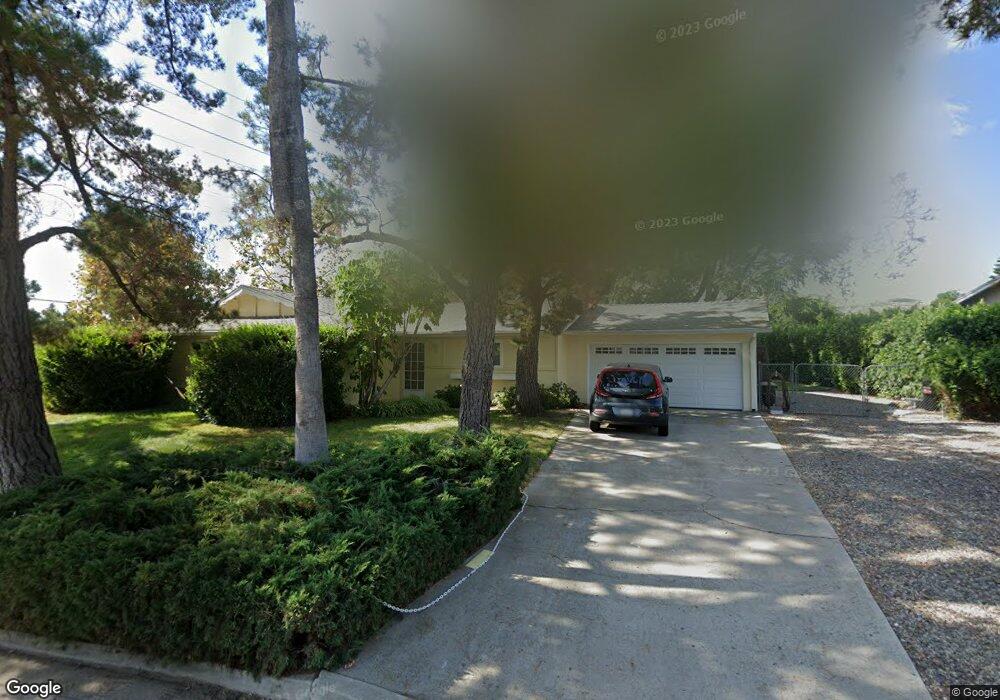
1411 Vaquero Dr Simi Valley, CA 93065
West Simi Valley NeighborhoodEstimated Value: $733,000 - $918,000
3
Beds
2
Baths
1,268
Sq Ft
$659/Sq Ft
Est. Value
About This Home
This home is located at 1411 Vaquero Dr, Simi Valley, CA 93065 and is currently estimated at $835,479, approximately $658 per square foot. 1411 Vaquero Dr is a home located in Ventura County with nearby schools including Madera Elementary School, Sinaloa Middle School, and Royal High School.
Ownership History
Date
Name
Owned For
Owner Type
Purchase Details
Closed on
Jun 12, 2018
Sold by
Read Mary Ann and Torchio James Anthony
Bought by
Read Mary Ann and Torchio James Anthony
Current Estimated Value
Purchase Details
Closed on
Jun 7, 1996
Sold by
Corbell Marjorie
Bought by
Torchio James Anthony and Read Mary Ann
Home Financials for this Owner
Home Financials are based on the most recent Mortgage that was taken out on this home.
Original Mortgage
$154,653
Outstanding Balance
$10,151
Interest Rate
8.3%
Mortgage Type
FHA
Estimated Equity
$825,328
Purchase Details
Closed on
Nov 29, 1993
Sold by
Corbell Marjorie
Bought by
Corbell Marjorie
Home Financials for this Owner
Home Financials are based on the most recent Mortgage that was taken out on this home.
Original Mortgage
$64,000
Interest Rate
4%
Create a Home Valuation Report for This Property
The Home Valuation Report is an in-depth analysis detailing your home's value as well as a comparison with similar homes in the area
Home Values in the Area
Average Home Value in this Area
Purchase History
| Date | Buyer | Sale Price | Title Company |
|---|---|---|---|
| Read Mary Ann | -- | None Available | |
| Torchio James Anthony | $160,000 | First American Title Ins Co | |
| Corbell Marjorie | -- | Fidelity National Title |
Source: Public Records
Mortgage History
| Date | Status | Borrower | Loan Amount |
|---|---|---|---|
| Open | Torchio James Anthony | $154,653 | |
| Previous Owner | Corbell Marjorie | $64,000 |
Source: Public Records
Tax History Compared to Growth
Tax History
| Year | Tax Paid | Tax Assessment Tax Assessment Total Assessment is a certain percentage of the fair market value that is determined by local assessors to be the total taxable value of land and additions on the property. | Land | Improvement |
|---|---|---|---|---|
| 2025 | $3,517 | $260,560 | $104,221 | $156,339 |
| 2024 | $3,517 | $255,451 | $102,177 | $153,274 |
| 2023 | $3,304 | $250,443 | $100,174 | $150,269 |
| 2022 | $3,268 | $245,533 | $98,210 | $147,323 |
| 2021 | $3,223 | $240,719 | $96,284 | $144,435 |
| 2020 | $3,143 | $238,253 | $95,298 | $142,955 |
| 2019 | $2,997 | $233,582 | $93,430 | $140,152 |
| 2018 | $2,957 | $229,003 | $91,599 | $137,404 |
| 2017 | $2,881 | $224,513 | $89,803 | $134,710 |
| 2016 | $2,747 | $220,112 | $88,043 | $132,069 |
| 2015 | $2,678 | $216,807 | $86,721 | $130,086 |
| 2014 | $2,628 | $212,562 | $85,023 | $127,539 |
Source: Public Records
Map
Nearby Homes
- 233 E Bonita Dr
- 1675 Tanglebush Ln
- 42 Skyflower Ln Unit 249
- 252 Capri Dr
- 459 Mark Dr
- 230 Farmhouse Dr Unit 3
- 1101 Hacienda Dr
- 300 Farmhouse Dr Unit 3
- 533 Mark Dr
- 114 Red Brick Dr Unit 1
- 118 Red Brick Dr Unit 1
- 310 Farmhouse Dr Unit 4
- 101 Red Brick Dr Unit 5
- 76 Robbins Ct
- 1100 N Country Club Dr
- 75 Vista Lago Dr
- 265 Hermes St
- 1778 Sinaloa Rd Unit 193
- 1778 Sinaloa Rd Unit 294
- 1421 Vaquero Dr
- 225 Royal Ave
- 1404 Vaquero Dr
- 1410 Vaquero Dr
- 222 Royal Ave
- 1420 Vaquero Dr
- 1441 Vaquero Dr
- 1430 Vaquero Dr
- 1405 Elvado Dr
- 1451 Vaquero Dr
- 1440 Vaquero Dr
- 1419 Elvado Dr
- 1427 Elvado Dr
- 1467 Elvado Dr
- 1450 Vaquero Dr
- 1461 Vaquero Dr
- 1487 Elvado Dr
- 1460 Vaquero Dr
- 1505 Elvado Dr
- 281 Royal Ave