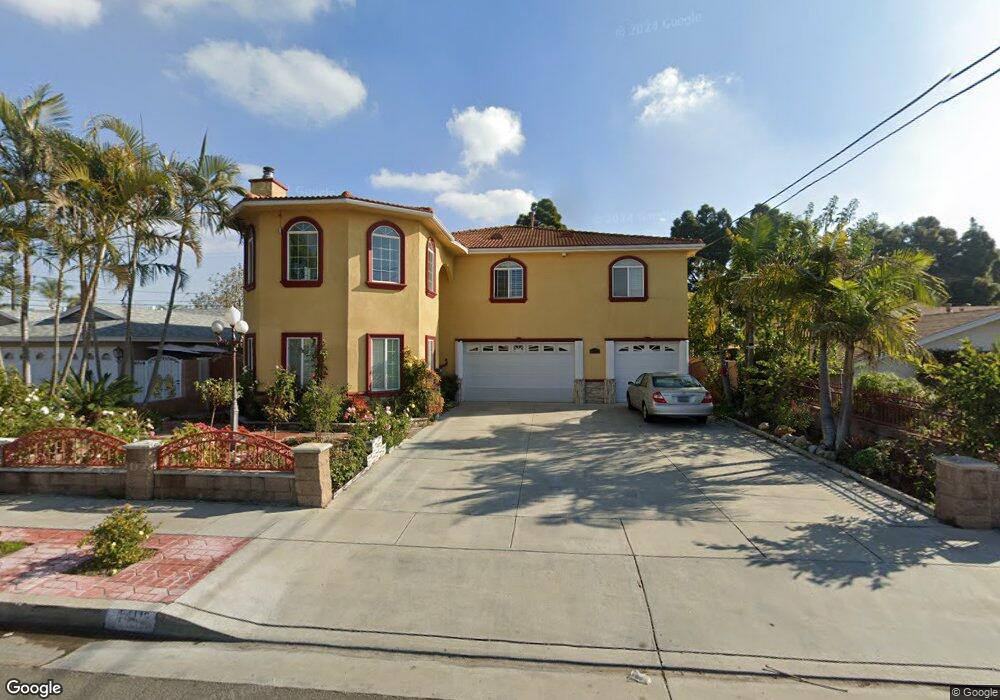
14112 Bowen St Garden Grove, CA 92843
Little Saigon NeighborhoodEstimated Value: $1,080,000 - $1,864,290
5
Beds
5
Baths
3,923
Sq Ft
$365/Sq Ft
Est. Value
About This Home
This home is located at 14112 Bowen St, Garden Grove, CA 92843 and is currently estimated at $1,432,823, approximately $365 per square foot. 14112 Bowen St is a home located in Orange County with nearby schools including Morningside Elementary School, James Irvine Intermediate School, and Bolsa Grande High School.
Ownership History
Date
Name
Owned For
Owner Type
Purchase Details
Closed on
Nov 21, 2014
Sold by
Bui Steven and Huynh Chau Thi
Bought by
Bui Family Trust
Current Estimated Value
Home Financials for this Owner
Home Financials are based on the most recent Mortgage that was taken out on this home.
Original Mortgage
$400,000
Outstanding Balance
$305,507
Interest Rate
3.92%
Mortgage Type
New Conventional
Estimated Equity
$1,127,316
Purchase Details
Closed on
May 7, 2010
Sold by
Bui Steven and Huynh Minh Chau Thi
Bought by
Bui Steven and Huynh Minh Chau Thi
Purchase Details
Closed on
Jul 8, 2008
Sold by
Bui Steven and Huynh Minh Chau Thi
Bought by
Bui Steven and Huynh Minh Chau Thi
Purchase Details
Closed on
Oct 20, 1993
Sold by
Huynh Minh Chau Thi and Huynh Bich Ngoc Thi
Bought by
Bui Steven and Huynh Minh Chau Thi
Home Financials for this Owner
Home Financials are based on the most recent Mortgage that was taken out on this home.
Original Mortgage
$133,000
Interest Rate
6.74%
Create a Home Valuation Report for This Property
The Home Valuation Report is an in-depth analysis detailing your home's value as well as a comparison with similar homes in the area
Home Values in the Area
Average Home Value in this Area
Purchase History
| Date | Buyer | Sale Price | Title Company |
|---|---|---|---|
| Bui Family Trust | -- | Accommodation | |
| Bui Steven | -- | Fidelity National Title Co | |
| Bui Steven | -- | None Available | |
| Bui Steven | -- | None Available | |
| Bui Steven | -- | Investors Title Company |
Source: Public Records
Mortgage History
| Date | Status | Borrower | Loan Amount |
|---|---|---|---|
| Open | Bui Steven | $400,000 | |
| Closed | Bui Steven | $133,000 |
Source: Public Records
Tax History Compared to Growth
Tax History
| Year | Tax Paid | Tax Assessment Tax Assessment Total Assessment is a certain percentage of the fair market value that is determined by local assessors to be the total taxable value of land and additions on the property. | Land | Improvement |
|---|---|---|---|---|
| 2025 | $12,414 | $1,045,602 | $214,797 | $830,805 |
| 2024 | $12,414 | $1,025,100 | $210,585 | $814,515 |
| 2023 | $12,189 | $1,005,000 | $206,455 | $798,545 |
| 2022 | $11,932 | $985,295 | $202,407 | $782,888 |
| 2021 | $11,805 | $965,976 | $198,438 | $767,538 |
| 2020 | $11,646 | $956,072 | $196,404 | $759,668 |
| 2019 | $11,414 | $937,326 | $192,553 | $744,773 |
| 2018 | $11,181 | $918,948 | $188,778 | $730,170 |
| 2017 | $11,025 | $900,930 | $185,077 | $715,853 |
| 2016 | $10,461 | $883,265 | $181,448 | $701,817 |
| 2015 | $9,360 | $786,971 | $177,387 | $609,584 |
| 2014 | $9,131 | $771,556 | $173,912 | $597,644 |
Source: Public Records
Map
Nearby Homes
- 14151 Lake St
- 10866 Westminster Ave Unit 1
- 10866 Westminster Ave Unit 10
- 14171 Flower St
- 14171 Flower St Unit 13
- 14356 Taft St
- 10061 15th St
- 13322 Euclid St
- 9884 11th St
- 5010 W Maurie Ave
- 5317 Silver Dr
- 13372 Jessica Dr
- 13801 Shirley St Unit 25
- 5405 W 4th St
- 11321 Parkgreen Ln Unit 102
- 13312 Michael Rainford Cir
- 1609 N Parsons Place
- 10391 Mildred Ave
- 9936 Pear Dr
- 10422 Bonnie Dr
- 14102 Bowen St
- 14116 Bowen St
- 14092 Bowen St
- 14122 Bowen St
- 14111 Bowen St
- 14121 Bowen St
- 14142 Bowen St
- 14101 Bowen St
- 14082 Bowen St
- 14131 Bowen St
- 14152 Bowen St
- 14141 Bowen St
- 14112 Stengel St
- 14122 Stengel St
- 10411 16th St
- 14102 Stengel St
- 14132 Stengel St
- 14162 Bowen St
- 10401 16th St
- 14161 Bowen St