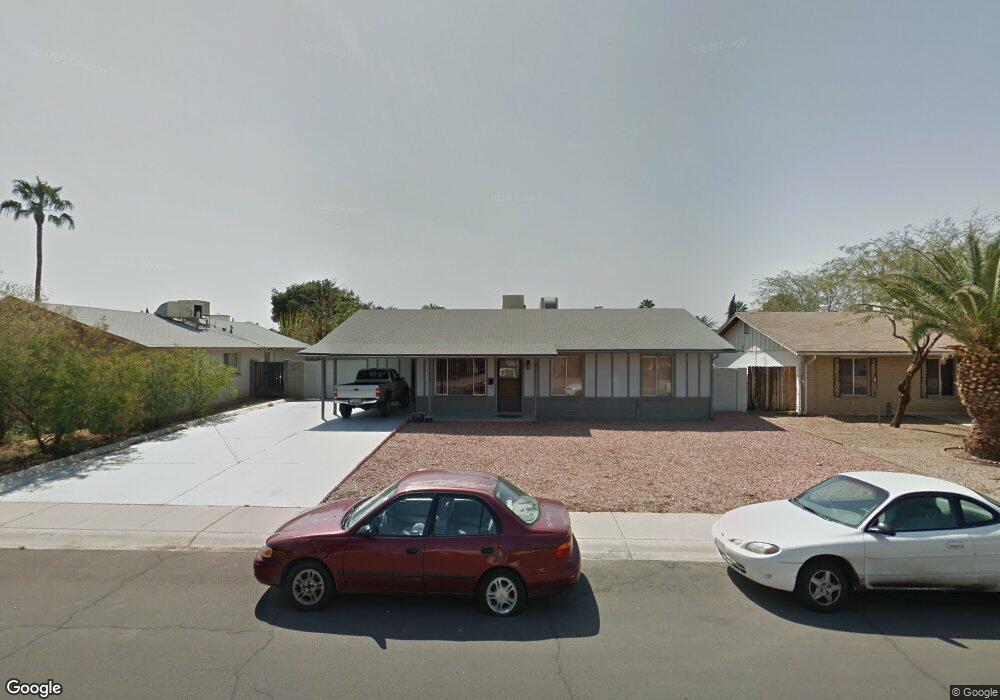
1415 E Verlea Dr Tempe, AZ 85282
Alameda NeighborhoodEstimated Value: $423,864 - $646,000
3
Beds
2
Baths
1,776
Sq Ft
$289/Sq Ft
Est. Value
About This Home
This home is located at 1415 E Verlea Dr, Tempe, AZ 85282 and is currently estimated at $513,716, approximately $289 per square foot. 1415 E Verlea Dr is a home located in Maricopa County with nearby schools including Joseph P. Spracale Elementary, Connolly Middle School, and McClintock High School.
Ownership History
Date
Name
Owned For
Owner Type
Purchase Details
Closed on
Mar 1, 2016
Sold by
Smith Tina
Bought by
The Simpatico Trust I and Schwartz Charles F
Current Estimated Value
Purchase Details
Closed on
May 21, 2013
Sold by
Gilrein John and Smith Tina
Bought by
Smith Tina
Home Financials for this Owner
Home Financials are based on the most recent Mortgage that was taken out on this home.
Original Mortgage
$176,000
Outstanding Balance
$129,091
Interest Rate
4.28%
Mortgage Type
New Conventional
Estimated Equity
$384,625
Purchase Details
Closed on
Jun 25, 2004
Sold by
Tarallo William
Bought by
Gilrein John and Gilrein Tina
Home Financials for this Owner
Home Financials are based on the most recent Mortgage that was taken out on this home.
Original Mortgage
$139,600
Interest Rate
6.27%
Mortgage Type
New Conventional
Purchase Details
Closed on
Jun 27, 1994
Sold by
Tarallo Rosina
Bought by
Tarallo Rosina
Create a Home Valuation Report for This Property
The Home Valuation Report is an in-depth analysis detailing your home's value as well as a comparison with similar homes in the area
Home Values in the Area
Average Home Value in this Area
Purchase History
| Date | Buyer | Sale Price | Title Company |
|---|---|---|---|
| The Simpatico Trust I | -- | None Available | |
| Smith Tina | -- | Lsi Title Company | |
| Gilrein John | $174,500 | Lawyers Title Ins | |
| Tarallo Rosina | -- | -- |
Source: Public Records
Mortgage History
| Date | Status | Borrower | Loan Amount |
|---|---|---|---|
| Open | Smith Tina | $176,000 | |
| Closed | Gilrein John | $139,600 | |
| Closed | Gilrein John | $17,450 |
Source: Public Records
Tax History
| Year | Tax Paid | Tax Assessment Tax Assessment Total Assessment is a certain percentage of the fair market value that is determined by local assessors to be the total taxable value of land and additions on the property. | Land | Improvement |
|---|---|---|---|---|
| 2025 | $2,753 | $22,972 | -- | -- |
| 2024 | $2,542 | $21,878 | -- | -- |
| 2023 | $2,542 | $38,700 | $7,740 | $30,960 |
| 2022 | $2,439 | $29,470 | $5,890 | $23,580 |
| 2021 | $2,455 | $27,150 | $5,430 | $21,720 |
| 2020 | $2,381 | $24,630 | $4,920 | $19,710 |
| 2019 | $2,336 | $23,460 | $4,690 | $18,770 |
| 2018 | $2,278 | $21,710 | $4,340 | $17,370 |
| 2017 | $2,210 | $20,120 | $4,020 | $16,100 |
| 2016 | $2,194 | $19,650 | $3,930 | $15,720 |
| 2015 | $2,108 | $18,280 | $3,650 | $14,630 |
Source: Public Records
Map
Nearby Homes
- 1410 E Verlea Dr
- 1314 E Verlea Cir
- 1514 E Verlea Dr
- 1412 E Broadmor Dr
- 1233 E Broadmor Dr
- 1445 E Broadway Rd Unit 115
- 1445 E Broadway Rd Unit 106
- 1445 E Broadway Rd Unit 120
- 1445 E Broadway Rd Unit 116
- 1445 E Broadway Rd Unit 208
- 2035 S Elm St Unit 138
- 2035 S Elm St Unit 109
- 2090 S Dorsey Ln Unit 1025
- 1109 E Bishop Dr
- 1405 E Campus Dr
- 2226 S Kachina Dr
- 1413 E Wesleyan Dr
- 1222 E Wesleyan Dr
- 2717 S Alder Dr
- 1633 E Wesleyan Dr
- 1421 E Verlea Dr
- 1404 E Bishop Dr
- 1427 E Verlea Dr
- 1403 E Verlea Dr
- 1322 E Bishop Dr
- 1422 E Bishop Dr
- 1414 E Verlea Dr
- 1420 E Verlea Dr
- 1416 E Bishop Dr
- 1503 E Verlea Dr
- 1321 E Verlea Dr
- 1426 E Verlea Dr
- 1404 E Verlea Dr
- 1316 E Bishop Dr
- 1500 E Bishop Dr
- 1502 E Verlea Dr
- 1324 E Verlea Dr
- 1326 E Verlea Dr
- 1401 E Bishop Dr
- 1319 E Verlea Dr
Your Personal Tour Guide
Ask me questions while you tour the home.